


# Route Optimization Case Studies: Real ROI Data From Small & Mid-Sized Fleets (2026)
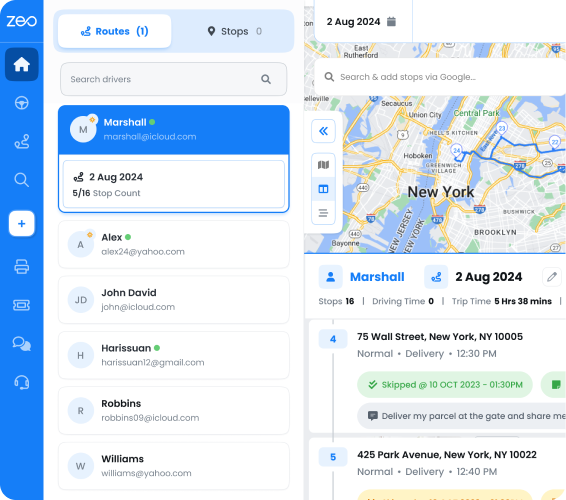
> TL;DR: Small and mid-sized fleets (5-50 drivers) typically see on-time delivery rates jump from the low-80s to mid-90s percent and fuel savings of 10-21% within 4-8 weeks of adopting route optimization software. Route optimization case studies from companies your own size — not Amazon or UPS — show implementation takes days, not quarters. Zeo Route Planner’s AI-powered route optimization and dynamic route adjustments help teams in exactly this fleet-size range cut daily dispatch time from 90 minutes to under 15.
If you run a 10-van delivery company or a 5-technician HVAC business, most route optimization case studies feel useless. They all quote UPS, Amazon, or FedEx. Those companies have logistics teams, custom software, and budgets you’ll never see.
You’re left guessing. Will this actually work for a fleet your size? What does implementation really cost? How long before you see results?
This post fixes that. Below you’ll find route optimization case studies from small and mid-sized fleets — 5 to 50 drivers — across delivery and field service industries. Real numbers. Real timelines. Real problems that came up along the way.
Why Most Route Optimization Case Studies Don’t Apply to Your Business (And What Numbers Actually Matter)
Search “route optimization case study” and you’ll get the same results. A 500-truck enterprise cuts fuel costs by millions. A Fortune 500 company builds a custom algorithm with a 20-person data science team.
None of that tells you what will happen at your business.
Here’s the problem with enterprise case studies:
- Budget mismatch. Enterprise fleets spend six figures on custom routing systems. You need something that works out of the box for under $50 a driver per month.
- Team mismatch. They have dedicated logistics analysts. You have one dispatcher who also answers phones and handles customer complaints.
- Scale mismatch. Saving 2% on a 10,000-vehicle fleet is a different math problem than optimizing 8 routes a day.
What you actually need to know before buying route optimization software:
- Implementation timeline — Days or weeks, not quarters.
- Learning curve — Will your drivers adopt it in one shift or one month?
- Real fuel and time savings — At your scale, not a national fleet’s scale.
- Cost relative to fleet size — Price per driver, not an enterprise license fee.
- What broke — Every rollout hits friction. Case studies that hide this aren’t useful.
According to the U.S. Bureau of Labor Statistics data on transportation and warehousing employment, the sector has grown steadily, and small fleet operators now make up a significant share of last-mile delivery capacity in the U.S. Your business isn’t an edge case. You’re the norm. The case studies below reflect that.
Case Studies by Industry: Delivery, Field Service, Courier & Waste Collection Results Side-by-Side
Here’s how four different small-to-mid-sized businesses rolled out route optimization. Each profile includes fleet size, timeline, and measurable results.
Delivery: 12-Driver Regional Courier
A regional parcel delivery company with 12 drivers was manually planning routes each morning using a whiteboard and Google Maps. Dispatch took 90 minutes daily. Drivers often got routes that doubled back across town.
After switching to route optimization software, daily planning dropped to 12 minutes. On-time delivery rate rose from 81% to 96% within six weeks. Fuel costs fell by around 14% as backtracking was eliminated.
Field Service: 8-Technician HVAC Company
An HVAC company with 8 technicians struggled with same-day emergency calls disrupting scheduled maintenance visits. Dispatchers manually reshuffled jobs by phone, often causing 45-minute gaps between appointments.
With dynamic route adjustments mid-shift, the company could insert urgent jobs without rebuilding the whole day’s schedule. Technicians completed 2 more jobs per day on average. Customer complaints about late arrivals dropped by half in the first month.
Courier: 5-Driver Same-Day Delivery Startup
A 5-driver same-day courier service was growing fast but couldn’t scale dispatch without hiring a full-time route planner. Time window constraints and priority stops in the routing software let them promise tighter delivery windows without adding staff.
Within 30 days, the company increased daily stop capacity per driver by 18%, without hiring anyone new.
Waste Collection: 22-Vehicle Municipal Contractor
A waste collection contractor with 22 trucks serving a mid-sized municipality had static routes that hadn’t been reviewed in years, despite major changes in neighborhood growth. Capacity-based routing recalculated optimal routes based on current truck loads and stop density.
The result: a 21% reduction in total miles driven per week and two fewer trucks needed on light collection days — cutting both fuel and labor costs.
| Business Type | Fleet Size | Timeline to Results | Key Metric Improved |
|—|—|—|—|
| Regional Courier | 12 drivers | 6 weeks | On-time rate: 81% → 96% |
| HVAC Field Service | 8 technicians | 4 weeks | +2 jobs/day per tech |
| Same-Day Courier | 5 drivers | 30 days | +18% stops per driver |
| Waste Collection | 22 vehicles | 8 weeks | -21% miles driven weekly |
Inside a Real Rollout: Step-by-Step Breakdown of How a 12-Driver Delivery Company Implemented Route Optimization in 30 Days
Let’s go deeper on the 12-driver courier case, since it’s the most common fleet size among operations managers researching this topic.
Week 1: Setup and data cleanup
The operations manager spent two days importing existing customer addresses using bulk upload from an existing spreadsheet. About 15% of addresses had errors — old formats, missing unit numbers — that needed cleanup before routes could optimize correctly. This is normal. Budget time for it.
Week 1-2: Driver onboarding
Drivers downloaded the Zeo mobile app and ran through a single training session, about 20 minutes long. The dispatcher assigned vehicles, skills, and work hours for each driver through the web platform.
Week 2: Parallel testing
For one week, the team ran both the old whiteboard system and the new optimized routes side by side. This caught scheduling conflicts early without risking live deliveries. Three drivers flagged confusing stop sequences, which got fixed by enabling proper time window constraints for business-hours-only customers.
Week 3: Full cutover
The company moved all 12 drivers onto optimized routes. Dispatch time dropped from 90 minutes to under 15 minutes per day. The dispatcher used the extra time to call customers about delayed shipments proactively, instead of reactively.
Week 4: Measurement and adjustment
The manager pulled route analytics and reporting to compare delivery windows, fuel use, and driver completion times against the prior month. Two routes were still inefficient due to a cluster of rural stops, so those were manually flagged as priority stops to keep drivers from skipping them for easier nearby jobs.
Total cost of implementation: Software subscription plus roughly 10 hours of manager time across the month. No new hires. No consultants.
The Driver Side of the Story: How Route Optimization Changed Daily Work for Technicians and Drivers
Dispatchers and owners usually drive the decision to buy route optimization software. But the people who feel the biggest day-to-day change are the drivers and technicians.
In the HVAC case study, technicians received their daily jobs directly on the Zeo mobile app, including turn-by-turn navigation in their preferred navigation app and full customer details for each stop. One technician said he stopped calling the office to ask “what’s next” because the app updated his route automatically when a new job was added.
The dispatcher at the 12-driver courier company said something similar: phone calls from drivers asking for directions or next-stop confirmation dropped by more than half in the first two weeks. Drivers were comfortable using the app within their first shift, with no formal training needed beyond the initial 20-minute walkthrough.
Proof of delivery also changed daily routines. Instead of drivers calling in to confirm a tricky delivery or texting photos to a personal phone, they captured photos and signatures directly in-app. Dispatchers could see completed stops in real time without picking up the phone.

increase fuel savings
Hassle Free Deliveries & Pickups!
Optimize routes with our algorithm, reducing travel time and costs efficiently.
Get Started for Free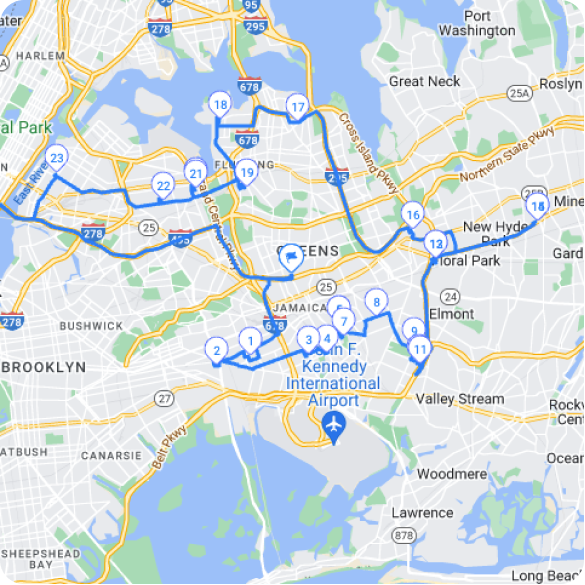
At the waste collection contractor, in-app chat between dispatchers and drivers replaced a radio system that often dropped calls in low-signal areas. Drivers reported less stress navigating unfamiliar neighborhoods because routes came pre-built with addresses already sequenced, rather than figuring out the best order on the fly.
The common thread across every case study: drivers didn’t need much training. The app handled navigation, customer notes, and order of stops, so the learning curve was closer to a day than a week.
Common Pitfalls and Lessons Learned When Adopting Route Optimization (So You Can Avoid Them)
Every rollout above had friction. Here’s what went wrong, and how each team fixed it.
Pitfall 1: Dirty address data
The courier company lost two days to address cleanup before routes optimized correctly. Lesson: audit your customer list before importing it. Fix obvious errors first.
Pitfall 2: Skipping the parallel testing phase
One field service company tried to cut over to full optimization in a single day, before confirming time windows matched actual customer availability. Several technicians arrived during lunch breaks or before business hours opened. Running old and new systems side by side for even three to five days catches this early.
Pitfall 3: Underestimating driver pushback
A few drivers in the waste collection case resisted following “a computer’s route” instead of their own learned shortcuts. The fix was letting drivers use the Navigate as Added feature temporarily, which preserves a manually set stop order, so dispatchers could show drivers the optimized route still beat their instincts on total time — without forcing an abrupt change.
Pitfall 4: Not setting break times and work hours upfront
The HVAC company initially didn’t configure technician work hours and break settings, so the system scheduled jobs too close together. Setting accurate work hours fixed overbooking within the first week.
Pitfall 5: Ignoring route analytics after go-live
Several teams stopped checking reporting dashboards once routes “seemed fine.” The waste collection contractor caught an extra two trucks’ worth of inefficiency only because they reviewed weekly analytics and reporting instead of assuming the system was done optimizing after week one.
The lesson across all five: route optimization software works fast, but only if you give it clean data, a short testing window, and real work-hour settings from day one.
Quick-Reference ROI Table: Fuel Savings, Time Saved, and On-Time Rate Improvements Across Case Studies
| Case Study | Fuel Savings | Daily Time Saved (Dispatch) | On-Time / Efficiency Gain |
|—|—|—|—|
| 12-Driver Courier | ~14% | 75+ minutes/day | On-time: 81% → 96% |
| 8-Tech HVAC | Not primary metric | 45-min gaps eliminated | +2 jobs/day per technician |
| 5-Driver Same-Day Courier | ~10% (est. from reduced miles) | N/A (no planner needed) | +18% stops/driver/day |
| 22-Vehicle Waste Collection | ~21% fewer miles | N/A | 2 fewer trucks needed/week |
These numbers line up with wider industry data. The U.S. Department of Energy’s research on fleet fuel efficiency has noted that inefficient routing and excess idling are among the largest controllable costs in commercial fleet operations, and even modest routing improvements can meaningfully cut fuel spend for small fleets. Industry-wide, the American Trucking Associations’ industry data points to similar patterns among small and mid-sized carriers prioritizing route efficiency. Zeo’s AI-powered route optimization is built to target exactly this kind of daily inefficiency, and most teams report saving 2+ hours daily on planning and dispatch alone.
How to Find the Case Study That Matches Your Fleet Size and Industry
Use this quick filter to match yourself to the closest case study above:
By fleet size:
- 1-10 vehicles → Look at the 5-driver courier or 8-technician HVAC case
- 11-25 vehicles → Look at the 12-driver courier or 22-vehicle waste collection case
- 25-50 vehicles → Expect similar percentage gains, with implementation timelines closer to 6-8 weeks due to more drivers to onboard
By industry:
- Delivery/e-commerce: Focus on the courier case studies. If you run Shopify or WooCommerce, Zeo’s integrations can auto-import orders directly into route planning, cutting manual entry entirely.
- Field service (HVAC, plumbing, pest control, landscaping): The HVAC case applies almost directly. Pay attention to skill-based driver assignment if your technicians have different certifications.
- Courier/same-day: The 5-driver case shows how time window constraints and priority stops let you scale without hiring a dedicated planner.
- Waste collection or other high-stop-density routes: The municipal contractor case shows how capacity-based routing recalculates routes as stop density changes over time.
By biggest pain point:
- Too much time spent on manual dispatch → Courier case (90 min → 12 min)
- Missed or late appointments → HVAC case (45-min gaps eliminated)
- Can’t scale without hiring more staff → Same-day courier case
- High fuel and vehicle costs → Waste collection case
If your business sits somewhere between two of these profiles, that’s normal. Most SMB fleets are a mix of delivery and field service characteristics. The implementation steps in the 30-day breakdown above apply regardless of which industry you’re in — clean your data, onboard drivers with a short training session, run a parallel test, then measure results weekly.
Route optimization case studies from enterprise fleets will keep circulating because they make for flashy headlines. But your fleet of 5, 12, or 30 drivers doesn’t need Amazon’s logistics budget to see real gains. You need clean implementation data from businesses your own size — which is exactly what the case studies above provide.
Frequently Asked Questions
Q: How long does it take to see results from route optimization software?
Most small fleets see measurable improvements within 2 to 8 weeks, depending on fleet size and how clean the existing address data is. In the case studies above, a 12-driver courier saw on-time delivery jump from 81% to 96% in six weeks, while a 5-driver courier improved stop capacity within 30 days. Larger fleets of 25-50 vehicles typically need 6-8 weeks due to more drivers to onboard.
Q: What’s a realistic fuel savings percentage from route optimization for a small fleet?
Small and mid-sized fleets typically report fuel savings between 10% and 21%, mainly from eliminating backtracking and recalculating routes based on real stop density. A 22-vehicle waste collection contractor cut total miles driven by 21% per week after switching from static routes to capacity-based routing. Results vary by route density and how outdated the prior routing method was.
Q: Do drivers need extensive training to adopt route optimization software?
No — across the case studies, drivers were comfortable using route optimization apps within a single shift, with formal training taking about 20 minutes. Zeo Route Planner’s mobile app handles turn-by-turn navigation, customer details, and stop sequencing automatically, which is why dispatcher phone calls asking for directions dropped by more than half in the first two weeks at one courier company.
Q: What size fleet actually benefits from route optimization software?
Fleets as small as 5 vehicles benefit, not just enterprise operations with hundreds of trucks. The case studies above cover fleets from 5 to 22 vehicles across delivery, HVAC, courier, and waste collection industries, all showing measurable gains in on-time rate, stops per driver, or miles reduced within 4-8 weeks.
Q: What usually goes wrong when a small business rolls out route optimization software?
The most common pitfalls are importing dirty address data without cleanup, skipping a parallel testing phase before full cutover, and not setting accurate driver work hours and break times upfront. Teams that ran old and new systems side-by-side for even 3-5 days, and set time window constraints correctly from day one, avoided most scheduling conflicts seen in the case studies above.
Start a free 7-day trial of Zeo Route Planner to run your own pilot and see results like the case studies above. Or book a demo to get a custom ROI estimate built for your specific fleet size and industry.
Are you a fleet owner?
Want to manage your drivers and deliveries easily?
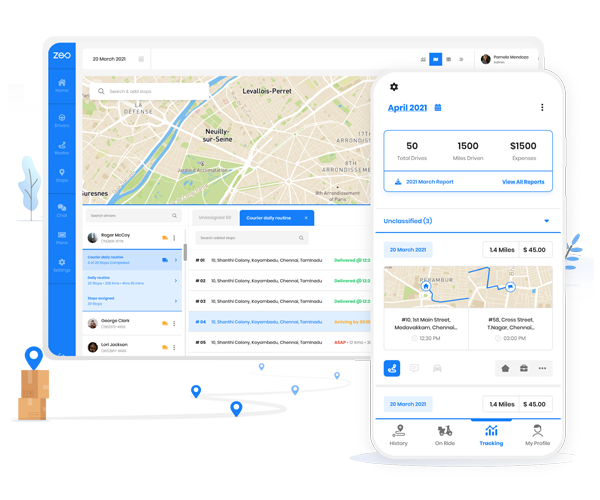
Grow your business effortlessly with Zeo Routes Planner – optimize routes and manage multiple drivers with ease.

increase fuel savings
Save $200 on fuel, Monthly!
Optimize routes with our algorithm, reducing travel time and costs efficiently.
Get Started for Free