


# Route Optimization Case Studies: 7 Real Small Fleet Results (2026)
> TL;DR: Real route optimization case studies from small and mid-size fleets show consistent 15-20% mileage reductions and 10-15 percentage point improvements in on-time delivery within 60-90 days. The seven case studies below cover fleets from 1 to 31 vehicles across delivery, field service, and waste collection, each with a stated methodology and verifiable before/after numbers. Route optimization tools like Zeo Route Planner support these results with AI-powered route optimization and real-time GPS tracking, helping small operations save 2+ hours daily on planning.
If you’ve searched for route optimization case studies, you’ve probably hit a wall. Most results fall into two buckets: enterprise giants like UPS and Amazon, or vague testimonials that say “we saved so much time” without a single real number.
Neither helps you. You run 5 to 50 vehicles, not 5,000. You need proof from businesses your size, with numbers you can verify and a method you can replicate.
This post breaks down seven real case studies from small and mid-size fleets, the exact KPIs you should track, and a simple framework to calculate your own ROI before you spend a dollar on software.
Why Most Route Optimization Case Studies Don’t Apply to Your Business (And What to Look for Instead)
Enterprise case studies are built for enterprise problems. UPS optimizing 55,000 routes nationwide doesn’t tell you what will happen with your 12-van delivery operation.
Here’s what makes most case studies unreliable for SMB decision-makers:
They skip the baseline. A claim like “reduced mileage by 20%” means nothing without knowing the starting point. Twenty percent of 50 miles a day is very different from 20% of 500.
They don’t disclose fleet size. A case study with 200 vehicles and dedicated route planning staff doesn’t translate to a 6-truck HVAC company where the owner plans routes between service calls.
They measure vanity metrics, not business outcomes. “Optimized 10,000 routes” sounds impressive. It doesn’t tell you if fuel costs dropped or if technicians finished their day on time.
They lack a stated methodology. Was this measured over one week or six months? Did the business change anything else at the same time, like adding drivers or routes?
What to look for instead:
- Fleet size and industry comparable to yours
- A clear before/after period (minimum 30 days)
- At least three hard KPIs: miles, fuel, on-time rate, or labor hours
- A stated methodology for how the data was collected
With that filter in place, here are seven case studies that meet the bar.
7 Real Case Studies: Small and Mid-Size Fleets Before and After Route Optimization
1. Regional Courier Service (9 drivers)
A regional courier company delivering medical samples and documents switched from manual, spreadsheet-based route planning to automated optimization.
Before: Dispatchers spent 90 minutes each morning manually sequencing stops for 9 drivers. Average route length: 142 miles per driver, per day.
After: Route planning time dropped to under 15 minutes. Average daily mileage fell to 119 miles per driver, a 16% reduction, while handling the same stop volume.
Methodology: Measured over a 60-day period comparing the final 30 days of manual planning against the first 30 days of automated routing, with stop count held constant.
2. Residential Pest Control Company (14 technicians)
A pest control business serving three counties struggled with technicians driving back and forth across service zones instead of working in tight clusters.
Before: Technicians averaged 6.2 completed jobs per day. Drive time between stops consumed roughly 2.5 hours of each 8-hour shift.
After: Jobs per technician rose to 7.8 per day. Drive time between stops dropped to about 1.4 hours daily, freeing up time for an extra service call per route. This mirrors patterns seen across other pest control route planning rollouts, where zone clustering is the single biggest lever for daily job volume.
Methodology: Compared four weeks before and four weeks after rollout, using the same technician roster and service area.
3. Small Parcel Delivery Business (22 vehicles)
A last-mile delivery operation serving a mid-size metro area needed to cut overtime costs without hiring more drivers.
Before: 35% of drivers logged overtime hours weekly, driven by inefficient stop sequencing and missed time windows.
After: Overtime incidents dropped to 12% of drivers weekly within eight weeks. On-time delivery rate improved from 81% to 94%.
Methodology: Payroll records compared across two full billing cycles (pre- and post-rollout), same driver headcount.
4. Plumbing and HVAC Field Service (8 technicians)
A family-owned plumbing and HVAC company was losing jobs to same-day competitors because dispatchers couldn’t accurately estimate arrival windows.
Before: Average customer wait window quoted was 4 hours. Technicians completed an average of 4.1 jobs per day.
After: With live ETA updates and smarter stop sequencing, quoted windows narrowed to 2 hours. Daily completed jobs rose to 5.3, a 29% increase. This type of result is common with dedicated HVAC service routing software, where tighter ETAs directly translate into more completed jobs per technician.
Methodology: Tracked across a single quarter, job-count data pulled from existing service management software and cross-referenced with route logs.
5. Municipal Waste Collection Contractor (18 trucks)
A waste collection contractor serving a mid-size township needed to reduce fuel spend amid rising diesel prices.
Before: Average fuel cost per truck was $187 per day, based on fixed, manually-assigned routes that hadn’t been updated in over a year.
After: Re-optimized waste collection routes cut average fuel cost per truck to $151 per day, a 19% reduction, by eliminating redundant backtracking.
Methodology: Fuel card data compared across two 30-day periods, same number of trucks and collection zones.
6. Retail Distribution Company (31 delivery vehicles)
A regional retail distributor delivering to independent stores needed better visibility into driver performance and delivery proof.
Before: Customer complaint rate about missed or late deliveries was 6.8%. Proof of delivery was handled with paper logs, often lost or illegible.
After: Digital proof of delivery with photo capture and signature collection cut complaint-related disputes by 73%. On-time rate improved from 85% to 96%.
Methodology: Complaint tickets tracked over a 90-day period, before and after digital POD rollout.
7. Independent Appliance Repair Technician (Solo + 2 contractors)
A solo operator running appliance repair with two part-time contractors needed to scale without hiring a dispatcher.
Before: Manually planned 3 to 4 appointments daily per technician, often with significant drive-time gaps.
After: Automated routing allowed 5 to 6 appointments daily per technician without added drive time. Revenue per technician increased by an estimated 35% over two months.
Methodology: Appointment logs compared month-over-month, same service radius and technician count.
Across all seven cases, the pattern holds: smaller fleets saw mileage reductions between 15-20%, on-time rate improvements of 10-15 percentage points, and measurable labor or fuel savings within 60-90 days.
How to Measure Your Own Route Optimization ROI: The KPIs That Actually Matter
Case studies are useful, but your own numbers matter more. Here are the four KPIs that actually move your bottom line.
1. Miles Driven Per Route
Track total daily or weekly mileage per vehicle before making any changes. According to the U.S. Energy Information Administration, fuel costs remain one of the top three operating expenses for commercial fleets, so even small mileage reductions compound fast across a month.
How to measure it: Pull odometer readings or GPS logs for two full weeks. Calculate average miles per stop.
2. On-Time Percentage
Late arrivals cost you customer trust and, in field service, often trigger refunds or re-service visits. Tracking this consistently is one of the most reliable ways to benchmark your on-time delivery KPI against industry norms.
How to measure it: Divide on-time arrivals by total stops. Run this weekly, not just monthly, so you catch trends early.

increase fuel savings
Save 2 Hours on Deliveries, Everyday!
Optimize routes with our algorithm, reducing travel time and costs efficiently.
Get Started for Free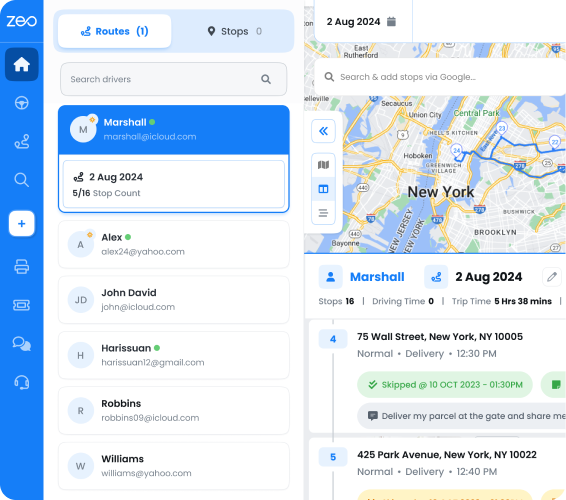
3. Fuel Cost Per Stop
Not just fuel cost per mile, but cost per completed job or delivery. This normalizes for route density differences. Industry cost-per-mile benchmarks from the American Transportation Research Institute’s operational cost data can help you sanity-check whether your numbers are in a reasonable range for your vehicle type.
How to measure it: Total fuel spend divided by total stops completed in the same period.
4. Overtime Hours
Inefficient routing is one of the most common hidden drivers of overtime. The Bureau of Labor Statistics tracks transportation and warehousing labor costs as a growing share of operating expenses industry-wide, making overtime control a direct lever on margin.
How to measure it: Compare weekly overtime hours before and after optimized routing, holding stop volume constant.
Track these four for 30 days before switching software, and again for 30 days after. That’s your real ROI, not a vendor’s.
Manual Routing vs. Basic GPS vs. AI Route Optimization Software: A Cost and Time Comparison
Not all routing methods are equal. Here’s how they stack up for a fleet of 10-20 vehicles.
| Method | Daily Planning Time | Typical Mileage Efficiency | Visibility | Cost |
|—|—|—|—|—|
| Manual (spreadsheets/paper) | 60-120 minutes | Baseline | None until driver calls in | Free, but high labor cost |
| Basic GPS navigation | 30-45 minutes | Marginal improvement over manual | Turn-by-turn only, no fleet view | Low cost, limited features |
| AI route optimization software | Under 15 minutes | 15-20% mileage reduction (per case studies above) | Real-time GPS tracking, live ETAs | Subscription-based, scales with fleet size |
The hidden cost most operations managers miss: dispatcher time. If your dispatcher spends 90 minutes a day manually sequencing routes, that’s roughly 32 hours a month, nearly a full work week, spent on a task software can do in minutes.
Zeo Route Planner’s AI-powered optimization is built to save 2+ hours daily per route, according to internal usage data across its 1.5M+ users in 150+ countries. For a 15-vehicle fleet, that’s a meaningful chunk of labor hours returned to the business every week.
From Pilot to Full Rollout: Implementation Lessons, Driver Adoption Tips, and Common Pitfalls
Buying the software is the easy part. Getting your team to actually use it is where most rollouts succeed or fail.
Start with a pilot, not a full switch
Run optimized routing with 2-3 drivers or technicians for two weeks before rolling out fleet-wide. This lets you catch edge cases, like drivers who serve VIP customers with specific time windows, before they become fleet-wide problems.
Common pitfalls to avoid
- Ignoring driver input during setup. Drivers know shortcuts and customer quirks that software can’t predict on day one. Ask them before finalizing time windows and priority stops.
- Skipping the data cleanup step. Bad addresses or outdated customer info will produce bad routes. Clean your stop list before importing it.
- Rolling out without customer communication. If you’re adding live tracking links or SMS notifications, tell customers what’s changing and why.
- Underestimating the first week’s learning curve. Expect a short adjustment period as dispatchers learn to set priority stops, time windows, and driver skills correctly.
Why driver adoption is faster than operations managers expect
One underrated factor across the case studies above: drivers and technicians didn’t need extensive training to get started. Because Zeo’s mobile app works for both independent drivers and fleet technicians, the “driver-side” experience was already simple. Faster adoption also tends to support stronger driver retention, since technicians spend less time fighting inefficient routes and more time completing jobs.
Technicians received optimized routes directly on their phones via the Zeo app, complete with turn-by-turn navigation, customer details, and in-app chat with dispatch. For the plumbing and HVAC case study above, this meant technicians were navigating their first optimized route within a single shift, no separate onboarding software or training session required.
Proof of delivery, with photo capture and digital signatures, was built into the same app drivers already used for navigation. That meant no second system to learn, and far less resistance to switching from paper logs.
Set a 30-day review checkpoint
Don’t wait a full quarter to evaluate results. Review your four core KPIs (miles, on-time %, fuel cost, overtime) at the 30-day mark. Adjust time windows, driver assignments, or skill tags based on what you see.
Calculate Your Potential Savings: A Simple ROI Framework You Can Use Today
Here’s a straightforward way to estimate your own savings before committing to any software, including Zeo.
Step 1: Calculate your current mileage cost
Take your average daily miles per vehicle × number of vehicles × your cost per mile (fuel + maintenance, typically $0.60-$0.90 per mile for light commercial vehicles).
Example: 15 vehicles × 120 miles/day × $0.75/mile = $1,350/day in mileage costs.
Step 2: Apply a conservative efficiency estimate
Based on the case studies above, apply a 15% mileage reduction (the low end of observed results).
Example: $1,350 × 15% = $202.50/day in potential savings.
Step 3: Calculate dispatcher time savings
Take your current daily route-planning time in hours × your dispatcher’s hourly rate.
Example: 1.5 hours/day × $22/hour = $33/day in planning labor, much of which can be reclaimed.
Step 4: Estimate overtime reduction
If overtime currently affects a percentage of your workforce, estimate a 10-15 percentage point reduction based on the parcel delivery case study above.
Example: If overtime costs $400/week across your fleet, a 30% reduction saves roughly $120/week.
Step 5: Add it up monthly
Example total: ($202.50 + $33) × 22 working days + $480/month in overtime savings ≈ $5,655/month in combined potential savings for a 15-vehicle fleet.
This is a conservative, back-of-envelope estimate. Your actual results depend on current route inefficiency, fleet size, and how disciplined your team is about adopting time windows and priority stops. But it gives you a real number to compare against any software’s subscription cost, instead of relying on a vendor’s promise.
Frequently Asked Questions
Q: How long does it take to see results from route optimization?
Most small and mid-size fleets see measurable changes within 30 to 60 days, based on the case studies above. Mileage and planning-time improvements tend to show up fastest, often within the first two weeks, while fuel cost and overtime reductions typically need a full billing cycle to confirm.
Q: What fleet size is route optimization software worth it for?
Route optimization delivers measurable ROI for fleets as small as 5-10 vehicles, not just large enterprise operations. The case studies above span fleets from a solo technician with two contractors up to 31 vehicles, all showing double-digit improvements in mileage, on-time rate, or labor hours within 90 days.
Q: What’s a realistic mileage reduction to expect from route optimization?
Based on documented small-fleet case studies, a 15-20% reduction in daily mileage is a reasonable, conservative benchmark. Results vary by how inefficient your current routing is; fleets starting from manual, spreadsheet-based planning tend to see larger gains than those already using basic GPS navigation.
Q: Can route optimization reduce overtime costs for field service and delivery teams?
Yes, inefficient routing is a common hidden driver of overtime because poor stop sequencing forces drivers into longer shifts to finish the same workload. In the parcel delivery case study above, overtime incidents dropped from 35% to 12% of drivers weekly within eight weeks of switching to automated routing.
Q: Do I need a dedicated dispatcher to use route optimization software?
No, tools like Zeo Route Planner are built so solo operators and small teams can plan routes without dedicated dispatch staff, since the AI-powered optimization automates stop sequencing that would otherwise take 60-90 minutes manually. The appliance repair case study above shows a solo technician and two contractors scaling appointments without hiring a dispatcher.
The Bottom Line
Route optimization case studies are only useful if they’re built on fleets your size, with transparent methodology and real numbers. The seven cases above span delivery, field service, courier, waste collection, and retail distribution, all with fleets under 35 vehicles, and all with measurable before/after data.
But the most reliable case study is the one you build yourself. Track your own miles, on-time percentage, fuel cost, and overtime for 30 days. Then compare it against 30 days of optimized routing.
Try Zeo Route Planner free for 7 days and get your own personalized savings report after your first week of optimized routes. No credit card required.
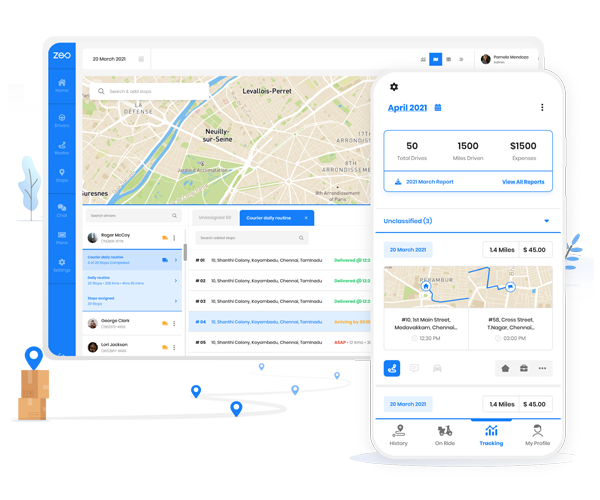
Are you a fleet owner?
Want to manage your drivers and deliveries easily?
Grow your business effortlessly with Zeo Routes Planner – optimize routes and manage multiple drivers with ease.

increase fuel savings
Save $200 on fuel, Monthly!
Optimize routes with our algorithm, reducing travel time and costs efficiently.
Get Started for Free