


# Route Optimization Case Studies for Small Fleets: Real Numbers by Industry (2026)
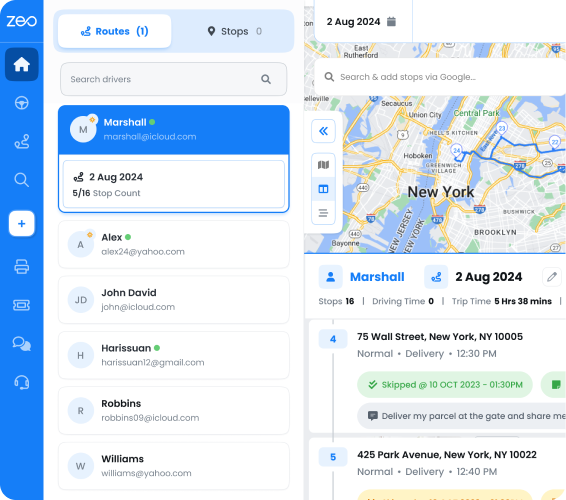
> TL;DR: Most route optimization case studies are written for companies 1,000x your size — but small fleets (5-50 vehicles) see ROI from a different source: eliminating manual planning time and fixing basic sequencing errors, not algorithmic sophistication. Across delivery, field service, and waste collection fleets under 35 vehicles, the consistent wins are hours of planning time saved, reduced backtracking mileage, and fewer missed stops. Zeo Route Planner’s AI-powered optimization targets these exact variables, saving dispatchers 2+ hours daily on manual route building.
If you run a 10-truck delivery company or manage 15 HVAC technicians, most route optimization case studies feel like they were written for a different planet. UPS saved $400 million with ORION. Amazon optimizes millions of stops a day with a logistics budget bigger than some national economies. DHL cites fuel savings measured in tanker trucks, not gallons.
None of that tells you what happens when you’re the one scheduling routes for 12 vans out of a spreadsheet at 6 a.m.
This post breaks down route optimization case studies that actually apply to fleets your size. We’ll show you real before/after numbers from delivery, field service, and waste management operations with 5-50 vehicles. We’ll explain exactly how ROI gets calculated, give you a framework to estimate your own savings, and tell you honestly what causes rollouts to fail. No enterprise fluff, no vague percentages you can’t verify.
Why Most Route Optimization Case Studies Don’t Apply to Your Fleet
Enterprise case studies and small-fleet reality are built on different assumptions. Here’s the comparison that usually gets left out.
Enterprise fleets (UPS, Amazon, FedEx) operate with dedicated logistics engineering teams, custom-built routing algorithms, and thousands of vehicles running fixed, repetitive routes. Their savings come from shaving seconds off millions of repeated stops. A 1% improvement at that scale equals millions of dollars, because the base volume is enormous.
Small-to-mid fleets (5-50 vehicles) operate differently. Routes change daily based on new customers, same-day service calls, or last-minute orders. There’s no logistics team — usually it’s one dispatcher or owner doing delivery-route planning done manually in spreadsheets, often with 20-30 minutes per driver just to build a rough plan each morning.
This matters because the source of savings is different. Enterprise ROI comes from marginal gains at massive scale. Small fleet ROI comes from eliminating manual planning time, cutting obvious inefficiencies (backtracking, poor sequencing, missed time windows), and reducing missed or late stops that cost you a customer.
A recent American Transportation Research Institute’s annual operational cost report found that poor routing and scheduling inefficiencies remain among the top controllable cost drivers for small carriers, right alongside fuel and driver wages. That’s your opportunity — not algorithm sophistication, but basic planning time and fuel waste that enterprise fleets solved years ago.
The takeaway: when you read “saves 2 hours a day,” ask whose 2 hours. For a dispatcher manually building 15 routes each morning, that’s realistic. For a company with an in-house optimization engineer, it’s not relevant anyway.
Real Results by Fleet Size and Industry: Delivery, Field Service, and Waste Management Case Studies
Here’s what route optimization looks like at the scale you actually operate in, broken down by industry.
Delivery (8-15 vehicles)
A regional courier running 12 vans for same-day parcel delivery was building routes manually in Google Maps, stop by stop. Dispatch took roughly 45 minutes every morning, and drivers regularly called in asking for re-sequencing mid-route when new orders came in.
After switching to automated route optimization, morning planning dropped to under 10 minutes. The time saved wasn’t from a smarter algorithm doing something humans couldn’t — it was from eliminating manual stop-by-stop sequencing across 12 separate routes simultaneously, something no single dispatcher can do quickly by hand once you’re past 6-8 stops per driver.
Field Service (10-20 technicians)
An HVAC and plumbing company with 15 technicians was assigning jobs based on who was “probably free” and geographic guesswork. Technicians frequently crossed paths covering overlapping territory, and the dispatcher had no visibility into real-time location to reassign emergency calls.
With skill-based job assignment and capacity-based routing, jobs got matched to the technician with the right certification who was also closest. Real-time GPS tracking let dispatch reassign an urgent call to whichever tech was nearest, instead of whoever was scheduled next. This is a direct result of two specific features working together — skill-based driver assignment and live location tracking — not a generic “AI efficiency” claim. For a deeper breakdown of how this applies specifically to HVAC teams, see this guide to HVAC route planning.
Waste Collection (20-35 vehicles)
A commercial waste hauler running 28 trucks across mixed residential and commercial waste collection routes struggled with route drift — routes built once, then never re-optimized as customers were added or dropped over the following year. New stops got bolted onto the nearest existing route by habit, not by actual proximity.
Rebuilding routes with capacity-based optimization (accounting for truck weight limits) and re-running optimization monthly instead of relying on static routes reduced unnecessary mileage from route drift. For waste and recycling specifically, the EPA’s guidance on municipal solid waste collection efficiency notes that collection route efficiency is one of the most direct levers haulers have over both fuel cost and emissions, since collection vehicles already have fixed stop counts — the only variable is sequencing.
What’s consistent across all three
In every case, the fleet size was under 35 vehicles, the “before” state was manual or semi-manual planning, and the savings came from time (less planning), fuel (less backtracking and drift), and service quality (fewer missed windows, faster reassignment). That’s the pattern worth paying attention to — not a headline percentage borrowed from a company 1,000x your size.
How ROI Is Actually Calculated: A Transparent Methodology You Can Verify
Most case studies hide the math. Here’s the methodology so you can check it against your own numbers instead of taking a vendor’s word for it.
Time savings = (minutes spent on manual route planning per day) × (number of planning days per month) × (dispatcher hourly rate)
If your dispatcher spends 45 minutes a day building routes for 15 drivers, that’s roughly 16.5 hours a month. At $22/hour, that’s $363/month in planning labor alone — before you’ve touched fuel or driver efficiency.
Fuel savings = (average miles driven per route before optimization − average miles driven per route after optimization) × (number of routes per day) × (fuel cost per mile)
This is the number that gets inflated in vague case studies. A legitimate calculation requires a real “before” mileage baseline, not an estimate. If you don’t currently track mileage per route, you can’t credibly claim a fuel savings percentage — you’re guessing. This is why the stronger case studies compare actual GPS-tracked mileage before and after, not projected mileage.
Labor efficiency = (additional stops completed per driver per day) × (driver hourly cost) × (working days per month)
If optimized sequencing lets a technician complete one extra service call per day without working longer hours, that’s capacity you didn’t have to pay extra wages for.
Missed-stop and late-arrival cost = (number of missed/late stops per month) × (average cost of a missed stop — redelivery, refund, or lost customer)
This is the number almost no case study calculates, and it’s often the largest one. For field service businesses, a missed appointment doesn’t just cost a redo — it damages customer trust and increases churn.
According to U.S. Bureau of Labor Statistics data on transportation and warehousing costs, transportation and warehousing labor costs have risen steadily, which means time saved on manual planning and driver idle time has a measurably higher dollar value today than it did five years ago. Run these four calculations against your own numbers, and you have a real ROI figure — not a borrowed enterprise statistic.
Calculate Your Own Savings: A Simple Framework for Estimating Time, Fuel, and Cost Reduction
You don’t need a data team to estimate your own savings. You need four numbers you probably already have, or can get in a week of tracking.
Step 1: Track your current planning time.
For five business days, time how long it actually takes to build your routes each morning. Most owners underestimate this until they time it.
Step 2: Track current average miles per route.
Pull this from your vehicle odometers, a GPS app, or your fuel cards for one week. You need a real baseline, not a guess.
Step 3: Count missed, late, or re-attempted stops.
Track this for two weeks. Each one has a cost — a redelivery trip, a refund, an annoyed customer, or a technician driving back out.
Step 4: Run the numbers.
Example for a 10-van delivery business:

increase fuel savings
Hassle Free Deliveries & Pickups!
Optimize routes with our algorithm, reducing travel time and costs efficiently.
Get Started for Free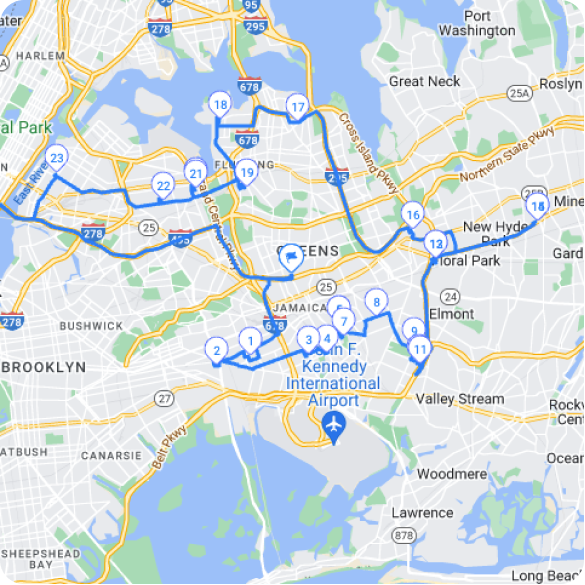
- Planning time: 40 min/day × 22 workdays × $20/hr = $293/month
- Mileage: 15% reduction on 200 miles/route/day × 10 vans × $0.65/mile fuel+maintenance cost = roughly $1,950/month
- Missed stops: 8/month × $35 average cost to resolve = $280/month
- Estimated monthly savings: ~$2,500
This is a framework, not a guarantee — your numbers will vary based on route density, drive times, and how inefficient your current planning actually is. But it gives you a real, defensible number instead of an enterprise percentage pulled from a press release.
Zeo Route Planner’s AI-powered optimization is built to attack exactly these four variables — it saves 2+ hours daily on planning time, and you can test your own routes through it during a free trial to see projected time and mileage differences before committing to anything.
Common Pitfalls That Sink Route Optimization Rollouts (And How to Avoid Them)
Case studies rarely mention the failures. Here’s what actually goes wrong, based on common rollout patterns across small-mid fleets.
Pitfall 1: Buying software without a baseline.
If you don’t measure your current planning time, mileage, or missed-stop rate before switching tools, you’ll have no way to prove ROI afterward — and no way to know if the tool is actually working. Fix: spend one week tracking your “before” numbers using the framework above, before you even start a trial.
Pitfall 2: Rolling out to all drivers on day one.
Dumping new software on your entire fleet at once means if something breaks or confuses drivers, it breaks for everyone simultaneously. Fix: pilot with 2-3 drivers or technicians for one to two weeks. Work out the kinks before scaling.
Pitfall 3: Ignoring driver pushback.
Drivers who’ve run the same routes for years often distrust an algorithm telling them a “better” way. If they quietly ignore the suggested route and drive their own way, you lose the optimization benefit entirely and won’t know it’s happening. Fix: show drivers the time and fuel difference directly, and start with routes where the improvement is obvious.
Pitfall 4: Not accounting for real-world constraints.
Software that doesn’t factor in time windows, vehicle capacity, or technician skill sets will generate routes that look efficient on paper but fail in practice — a plumber routed to a job requiring an electrician, or a truck routed to a stop it can’t physically access. Fix: confirm the software supports capacity-based routing, time windows, and skill-based assignment before you commit, not after.
Pitfall 5: Treating it as a one-time setup.
Routes drift. New customers, canceled stops, and seasonal changes mean a route built once in January is inefficient by June. Fix: re-optimize regularly, not just at initial rollout — especially if you run scheduled or recurring routes.
The single biggest predictor of rollout failure isn’t the software’s accuracy. It’s whether your team actually uses it.
From Manager Dashboard to Driver’s Pocket: Making Optimization Stick With Your Team
Every case study number in this article assumes one thing: that drivers and technicians actually followed the optimized route. If they didn’t, the savings never happened — they just stayed on paper.
This is where most rollouts quietly fail. A manager builds a perfect route on a screen, but the person driving it never sees that screen. They get a printed sheet, a verbal rundown, or nothing at all, and default back to the route they’ve always driven.
Zeo closes that gap with a single connected system. Fleet managers plan and assign routes on the Zeo web platform, and those routes land directly on the same Zeo mobile app that individual drivers already use for navigation. Your technicians receive optimized routes directly on their phones, complete with turn-by-turn navigation, customer details, and time windows — no separate printout, no manual relay, no translation step where the plan gets lost.
That matters for three specific reasons:
Navigation is built in. Drivers aren’t asked to manually re-enter addresses into Google Maps or Waze. Zeo supports multiple navigation apps, so technicians can route through whichever app they already trust.
Proof of delivery closes the loop. When a technician finishes a stop, they capture a photo, collect a signature, or add delivery notes directly in the app as part of Zeo’s proof of delivery feature set. That data flows back to the dispatcher in real time — which is also how you’ll measure whether your ROI framework numbers are actually improving month over month.
Mid-shift changes don’t require a phone call. If a stop gets added or an emergency job comes in, dispatch can adjust the route dynamically, and the driver sees the update on their phone immediately, with in-app chat available if clarification is needed.
This is the practical difference between a route optimization tool that produces impressive dashboard numbers and one that produces real-world savings. The technology only pays off once it’s in the hands of the people actually driving the routes — and that adoption bridge is often the part vendors leave out of their case studies entirely.
Frequently Asked Questions
Q: How many case studies do I need to validate ROI before switching route optimization software?
You don’t need external case studies at all — one week of tracking your own planning time, mileage, and missed-stop rate gives you a baseline that’s more reliable than any vendor case study. Most legitimate ROI estimates for small fleets rely on 2-4 weeks of real “before” data compared against the same metrics after rollout. This is why a free trial, where you can run your actual routes and compare projected numbers, is often more useful than reading about someone else’s fleet.
Q: What’s a realistic fuel savings percentage from route optimization for a small fleet?
Realistic fuel savings for fleets under 50 vehicles typically range from 10-20% in mileage reduction, depending on how inefficient the current manual routing is. Fleets with heavy backtracking or “route drift” (stops added onto the nearest existing route rather than the most efficient one) tend to see savings at the higher end. Any claim above that without a verified GPS-tracked mileage baseline should be treated with skepticism.
Q: Why don’t enterprise route optimization case studies (UPS, Amazon, DHL) apply to small fleets?
Enterprise case studies measure marginal gains across millions of repeated, fixed stops, so a 1% improvement translates to massive dollar figures purely because of volume. Small fleets with 5-50 vehicles have daily route variability and no dedicated logistics team, so their savings come from a completely different source: eliminating manual planning time and fixing basic sequencing errors, not algorithmic sophistication.
Q: How do I calculate missed-stop costs for my route optimization ROI estimate?
Multiply the number of missed, late, or re-attempted stops per month by the average cost to resolve one (redelivery trip, refund, technician driving back out, or an unhappy customer’s lifetime value). This is the ROI variable most case studies skip, even though it’s often the largest dollar figure in the calculation. Tracking it for two weeks gives you a number specific to your business instead of an industry average.
Q: Does route optimization software actually work if drivers ignore the suggested routes?
No — if drivers quietly revert to their own routes, the optimization savings never materialize even if the software’s output is accurate. Zeo Route Planner addresses this by pushing manager-assigned routes directly to the same mobile app drivers already use for turn-by-turn navigation, removing the printout-or-verbal-relay step where most rollouts break down. Pairing that with a 2-3 driver pilot before full rollout is the most reliable way to confirm adoption before scaling.
See What Your Fleet Could Save
Enterprise case studies tell you what’s possible with a billion-dollar logistics budget. They don’t tell you what’s possible with 10 trucks, 15 technicians, or a dispatcher doing route planning by hand every morning.
The framework in this article gives you a way to estimate your own numbers using your own planning time, mileage, and missed-stop data — not someone else’s percentage. For more real-world numbers across different fleet sizes, see these verified route optimization case studies.
Start a free Zeo Route Planner trial and run your actual routes through the optimizer to see projected time and fuel savings for your fleet, with no credit card required. Or book a demo to get a custom ROI estimate based on your specific fleet size and industry.
Are you a fleet owner?
Want to manage your drivers and deliveries easily?
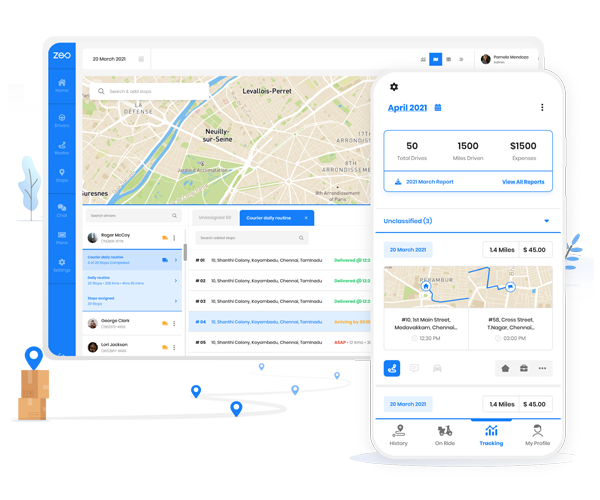
Grow your business effortlessly with Zeo Routes Planner – optimize routes and manage multiple drivers with ease.
increase fuel savings
Save 2 Hours on Deliveries, Everyday!
Optimize routes with our algorithm, reducing travel time and costs efficiently.
Get Started for Free