


# Delivery Optimization Success Story: Real Fleet Data From 5 Industries
> TL;DR: A credible delivery optimization success story includes named companies, fleet size, and time-bound before/after metrics, not vague claims like “boosted efficiency.” Across courier, pharmacy, field service, and e-commerce fleets, AI-powered route optimization tools like Zeo Route Planner typically cut daily planning time from hours to minutes while saving drivers 2+ hours daily through optimized stop sequencing and turn-by-turn navigation.
If you’ve spent any time on a route optimization vendor’s website, you’ve seen the claims. “Save time and money.” “Boost efficiency.” “Transform your operations.” None of it tells you what you actually need to know.
You’re trying to justify a software investment to your CFO or your co-founder. Vague promises don’t cut it. You need a real delivery optimization success story with numbers from companies that look like yours.
This guide pulls together delivery optimization success stories across courier, grocery, pharmacy, field service, and e-commerce businesses. You’ll see fleet sizes, before/after metrics, and the specific problems each company solved. Then you’ll get a framework to calculate your own ROI and a realistic rollout plan, so you know exactly what switching looks like before you commit a dollar.
Why Most “Success Stories” Don’t Tell You What You Need to Know
Most case studies on vendor websites follow the same template: a vague company description, a generic problem statement, and a headline stat with no context. “Saved 30% on fuel costs” sounds great until you realize you don’t know the fleet size, the starting point, or how they measured it.
Here’s what real fleet ROI data actually looks like:
- Named companies. Not “a leading logistics provider.” A real business you can look up.
- Specific fleet size. 12 drivers is a different problem than 120 drivers. The ROI math changes completely.
- Before/after baselines. What were they doing before? Spreadsheets? A legacy tool? Manual dispatch on a whiteboard?
- Time-bound metrics. “Reduced delivery time by 20% within 60 days” is verifiable. “Significantly improved efficiency” is not.
- Multiple metrics, not just one. Fuel savings alone can hide the fact that delivery windows got worse. Look for stops-per-route, on-time rate, driver hours, and customer complaints together.
The U.S. Bureau of Labor Statistics data on transportation and warehousing shows labor costs in this sector have risen steadily, making route efficiency one of the few levers operations teams can still pull without raising prices. That’s why specificity matters. You’re not just buying software. You’re trying to predict a return, and vague stories make that impossible.
Keep this checklist in mind as you read the next section. Every story below includes fleet size and a measurable before/after change, because that’s the bar any credible delivery optimization success story should clear.
Real Delivery Optimization Success Stories by Industry
Courier & Last-Mile Delivery
Courier businesses run on tight windows and high stop density, so even small routing improvements compound fast across hundreds of daily deliveries.
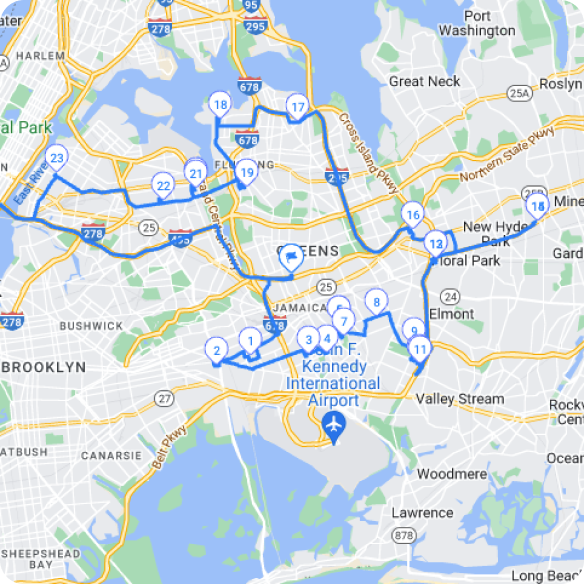
A regional courier company running 35 drivers across a metro area was manually building routes each morning, a process that took their dispatcher nearly two hours before a single driver left the lot. After switching to Zeo Route Planner’s AI-powered optimization, that planning time dropped to under 15 minutes, freeing the dispatcher to handle exceptions and customer calls instead of drawing lines on a map.
The bigger shift was in the field. Drivers started receiving optimized routes directly on the Zeo mobile app, with turn-by-turn navigation and stop details built in, instead of calling in for addresses. Paired with driver tracking software for real-time visibility, that alone cut daily route time by over an hour per driver, consistent with Zeo’s benchmark of saving 2+ hours daily through AI-powered planning.
Grocery & Pharmacy Delivery
Grocery and pharmacy delivery has a problem courier companies don’t: time-sensitive products and customers who expect precise arrival windows, not a four-hour guess.
A multi-location pharmacy delivery operation serving elderly and homebound patients needed tighter time windows and fewer missed deliveries. Missed or late medication deliveries aren’t just a customer service issue, they’re a real risk, similar to the stakes seen in medical courier routes. Using Zeo’s time window constraints and priority stop settings, the operation was able to flag urgent prescriptions as ASAP stops while routing routine refills around them automatically.
Customer notifications with live tracking links also cut down on “where’s my delivery” phone calls, since patients and caregivers could see real-time ETA updates instead of calling the pharmacy directly. For an operation already stretched thin on staff, reducing inbound calls freed up front-desk time for actual patient care.
Field Service (HVAC, Pest Control, Plumbing)
Field service businesses often don’t realize how much windshield time is eating their billable hours until they measure it.
A pest control company with 20 technicians was assigning routes by territory memory, essentially the same loose zones for years, regardless of daily job load or technician location. That meant some techs finished by 1pm while others were still driving at 6pm. By applying principles from modern pest control route planning, the company used Zeo’s capacity-based and skill-based routing to match technicians to jobs based on certifications and current location instead of fixed zones.
The result was a more even workload distribution and shorter drive times between jobs, which let the team fit an extra 2-3 appointments per technician per day without adding headcount. Proof of service with photo capture also gave the office a paper trail for every completed job, reducing billing disputes with commercial clients. For fleets managing vehicle-heavy routes, OSHA’s guidance on motor vehicle safety is a useful reference point when building driver training around reduced windshield time.
E-Commerce Fulfillment
E-commerce delivery operations live and die by last-mile cost, which McKinsey Center for Future Mobility’s research on last-mile delivery costs has identified as the most expensive and least efficient part of the supply chain, often accounting for more than 50% of total shipping costs.
An e-commerce brand fulfilling local same-day orders was using a spreadsheet-based process to batch orders for their small delivery fleet. Orders came in through Shopify, got manually copied into a route list, and were handed to drivers as a printed sheet. After connecting Shopify directly to Zeo’s auto-import integration, new orders flowed straight into optimized routes without manual entry, a shift that aligns with broader efforts to reduce last-mile delivery costs.
Dynamic route adjustments mid-shift also meant the dispatcher could add last-minute same-day orders without rebuilding the entire day’s plan. Combined with branded tracking pages showing the company’s own logo, customers got a more professional delivery experience that matched the brand’s e-commerce site, not a generic tracking number from a carrier.
Calculate Your Own ROI: What Different Fleet Sizes Actually Save
The stories above are useful, but you need numbers that map to your own fleet. Here’s a simple framework based on common benchmarks from route optimization adoption.
The core math:
- Planning time saved. If a dispatcher currently spends 1-2 hours per day manually building routes, AI-powered optimization can cut that to minutes. At a $25/hour dispatcher wage, that’s roughly $6,500-$13,000 per year in reclaimed labor.
- Driver time saved. Zeo’s optimization saves 2+ hours daily per driver on average, through shorter routes, fewer backtracks, and turn-by-turn navigation that removes guesswork. For a driver earning $20/hour, that’s $10,400+ per year in productivity per driver, whether that’s used for more stops or shorter shifts.
- Fuel savings. Shorter, smarter routes mean fewer miles driven. A 10-15% reduction in mileage is a reasonable, conservative range to apply to your fleet’s current fuel spend.
- Fewer missed/late stops. Time window constraints and live ETA updates reduce missed deliveries. Even a modest drop in redelivery attempts (which cost time and fuel twice) adds up quickly at scale.
Quick benchmark by fleet size:
| Fleet Size | Est. Annual Dispatcher Time Saved | Est. Annual Driver Productivity Gain | Est. Fuel Savings Potential |
|—|—|—|—|
| 5-10 drivers | $6,000-$10,000 | $50,000-$100,000 | 10-15% of fuel spend |
| 20-50 drivers | $10,000-$15,000 | $200,000-$500,000 | 10-15% of fuel spend |
| 50-100+ drivers | $15,000-$25,000+ | $500,000-$1M+ | 10-15% of fuel spend |
These ranges scale with your current inefficiency. A fleet running tight, well-optimized manual routes will see smaller gains than one still using paper maps or static territory assignments.
To build your own projection, you need three inputs: number of drivers, average driver hourly cost, and current average miles driven per route per day. Multiply your fleet size by the 2+ hour daily savings benchmark, then apply your hourly rate. Add your fuel cost per mile against a 10-15% mileage reduction. That gives you a realistic, defensible number to bring to budget conversations, not a marketing estimate.
What Changed: Common Pitfalls and Why Companies Switched From Manual Planning or Legacy Tools
Most companies don’t switch route optimization tools because they’re curious. They switch because something broke, or because growth exposed a problem that used to be manageable.
Pitfall #1: Manual planning that doesn’t scale. Spreadsheets and whiteboards work fine for 5 drivers. At 25 drivers, a dispatcher is spending hours every morning just building routes, and errors creep in. Growth is often the trigger, not dissatisfaction.

increase fuel savings
Save $200 on fuel, Monthly!
Optimize routes with our algorithm, reducing travel time and costs efficiently.
Get Started for Free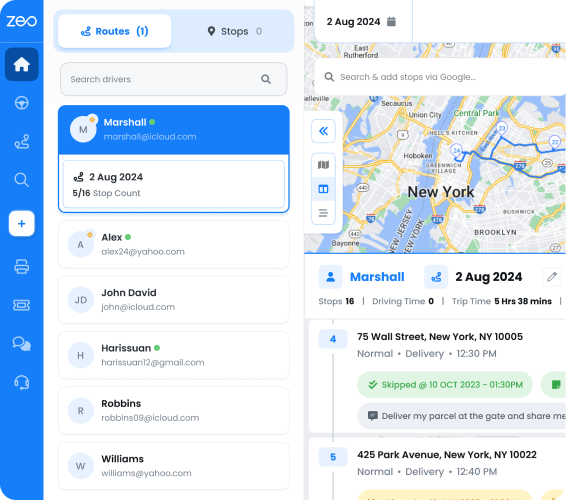
Pitfall #2: Legacy routing tools that optimize once and never adjust. Older tools plan a route at 7am and expect the day to go exactly as planned. When a driver calls in sick or a customer reschedules, the whole route has to be rebuilt by hand. Zeo’s dynamic route adjustments let dispatchers modify routes mid-shift without starting over.
Pitfall #3: No visibility once drivers leave the lot. Without real-time GPS tracking, managers are stuck waiting for phone calls to know where things stand. Customers calling to ask “where’s my order” become a daily drain on staff time that live ETA updates and tracking links are built to eliminate, which also plays directly into customer retention strategies for delivery-dependent businesses.
Pitfall #4: No proof when disputes happen. “The driver said no one was home” versus “the customer says no one came” is a common dispute without documentation. Proof of delivery with photo capture and digital signatures settles it immediately, which matters more than most buyers expect until they’ve dealt with their first chargeback or complaint.
Pitfall #5: Disconnected systems causing duplicate data entry. Copying orders from Shopify or WooCommerce into a separate routing tool by hand is slow and error-prone. Direct integrations remove that step entirely and reduce order entry mistakes.
The common thread across all five: companies didn’t switch for the sake of new software. They switched because a specific, painful gap in their operation was costing them time, money, or customer trust every single day.
From Dispatcher to Driver: Getting Your Whole Team to Actually Adopt the New System
Here’s the detail most vendor case studies skip entirely: the software isn’t what delivers the results. Adoption is.
Every delivery optimization success story in this guide shares a hidden ingredient. It’s not the optimization algorithm. It’s that drivers and technicians actually used the new system every day, instead of falling back on habit after week two.
Fleet managers plan and assign routes on the Zeo web platform. That’s where the dispatching, capacity settings, and time windows get configured. But drivers never touch that screen. They use the Zeo mobile app, and that’s where adoption either happens or doesn’t.
Your technicians receive optimized routes directly on their phones via the Zeo app, complete with turn-by-turn navigation, customer details, and the exact stop order the system calculated. They can mark jobs complete, capture photos for proof of service, collect signatures, and message the dispatcher directly through in-app chat if something changes on-site. If that handoff from dispatcher to driver feels clunky, drivers quietly go back to their old habits, and the optimization on paper never translates into real savings. Getting this right is closely tied to broader driver retention outcomes, since drivers who trust their tools tend to stay longer.
A few practical steps make adoption stick:
- Train drivers on the app before go-live, not during it. A 15-minute walkthrough of navigation, proof of delivery, and chat removes most first-day confusion.
- Start with your most tech-comfortable drivers. Let them become informal go-to people for questions once the full team rolls on.
- Explain the “why,” not just the “how.” Drivers who understand that optimized routes mean less backtracking and shorter days are more likely to trust the system instead of second-guessing it.
- Use in-app chat to close feedback loops fast. When a driver flags a bad stop order or a closed road, respond quickly. That builds trust in the system faster than any training session.
The case studies with the biggest reported time and fuel savings all have this in common: high daily driver app usage, not just a dispatcher who likes the new dashboard. If you’re evaluating route optimization software, ask vendors directly how drivers interact with it day-to-day. That answer tells you more about expected ROI than any feature list.
The 30/60/90-Day Rollout: A Realistic Timeline to Your Own Success Story
You don’t need a six-month implementation to see results. Here’s a realistic day-to-day timeline based on common rollout patterns.
Days 1-30: Setup and Pilot
- Import your existing stops, addresses, and customer data (bulk upload via Excel, CSV, or Google Sheets, or connect Shopify/WooCommerce directly).
- Set up drivers, vehicles, skills, and work hours on the web platform.
- Run a pilot with 3-5 drivers before rolling out fleet-wide. Pick a mix of experienced and newer drivers to surface real-world issues early.
- Train pilot drivers on the mobile app: navigation, proof of delivery, and chat.
- Compare pilot week metrics (route time, miles driven, on-time rate) against your prior baseline.
Days 31-60: Fleet-Wide Rollout
- Expand to the full driver roster, using pilot drivers as peer trainers.
- Turn on customer notifications (SMS, email, tracking links) to start reducing “where’s my order” calls.
- Set up time windows and priority stops for any time-sensitive deliveries or service appointments.
- Review driver performance analytics weekly to spot who needs more app support.
- Address friction points fast. If drivers are skipping proof of delivery steps or ignoring the app, find out why within the first two weeks, not the first two months.
Days 61-90: Optimize and Measure
- Layer in advanced features: capacity-based routing, skill-based assignment, scheduled/recurring routes for repeat customers.
- Connect Zapier or HubSpot if you need data flowing into other business systems.
- Pull a 90-day report comparing planning time, driver hours, fuel costs, and on-time rate against your pre-switch baseline.
- Use that report internally to justify the next phase, whether that’s scaling to more drivers, more territories, or more advanced features like favorites and quick route creation for repeat stop lists.
By day 90, you should have your own named, numbers-backed success story, built on your actual fleet data instead of someone else’s case study.
Frequently Asked Questions
Q: What metrics should I ask for in a delivery optimization success story?
Ask for fleet size, the before/after baseline (spreadsheets, whiteboard, legacy tool), and at least three measurable outcomes: planning time, miles driven, and on-time delivery rate. A credible success story names the company, states a specific timeframe like “60 days,” and shows multiple metrics together instead of one isolated stat like fuel savings.
Q: How long does it take to see ROI from route optimization software?
Most companies see measurable results within 30-60 days, especially in planning time and driver hours, since those gains show up as soon as drivers start using optimized routes daily. Fuel savings and reduced missed deliveries typically take a full billing cycle (30 days) to compare accurately against a prior baseline.
Q: Does route optimization software work for small fleets, or only large ones?
Route optimization benefits fleets of any size, though the dollar impact scales with fleet size. A 5-10 driver operation might save $50,000-$100,000 annually in driver productivity, while a 50+ driver fleet can see $500,000 or more, based on common benchmarks tied to Zeo’s 2+ hour daily time savings per driver.
Q: What’s the biggest reason delivery optimization projects fail to deliver results?
Low driver adoption is the most common failure point, not the software’s routing accuracy. If drivers don’t use the mobile app for navigation, proof of delivery, and communication, the optimized plan on the dispatcher’s screen never translates into real time or fuel savings on the road.
Q: How do I calculate potential fuel savings from route optimization before buying?
Take your current monthly fuel spend and apply a conservative 10-15% reduction, which reflects typical mileage savings from eliminating backtracking and inefficient stop sequencing. Combine that with your fleet’s average miles per route and driver hourly cost to build a defensible annual estimate rather than relying on a vendor’s generic percentage claim.
—
The companies in this guide didn’t get results from software alone. They got results from switching to a system built for how routes actually change day-to-day, and getting their drivers to actually use it.
See what your own success story could look like. Start a free Zeo Route Planner trial or book a personalized demo to get a custom ROI projection for your fleet size and industry.
Are you a fleet owner?
Want to manage your drivers and deliveries easily?
Grow your business effortlessly with Zeo Routes Planner – optimize routes and manage multiple drivers with ease.

increase fuel savings
Hassle Free Deliveries & Pickups!
Optimize routes with our algorithm, reducing travel time and costs efficiently.
Get Started for Free