


# Delivery Optimization Success Story: Real Results by Fleet Size and Industry
> TL;DR: A real delivery optimization success story shows specific before-and-after numbers, not vague promises, segmented by fleet size and industry. Fuel and driver wages account for over 60% of fleet operating costs, so even modest routing improvements translate into real savings. Route optimization tools like Zeo Route Planner address this with AI-powered routing that saves 2+ hours daily on planning, helping delivery and field service teams turn routing guesswork into measurable ROI.
Search “delivery optimization success story” and you’ll find dozens of blog posts making the same vague promises. “Save time and money.” “Boost efficiency.” None of them show you a single real number.
That’s a problem if you’re managing 5, 50, or 200 drivers and considering a switch. You need proof, not slogans.
This guide breaks down what actual results look like, segmented by fleet size and industry. You’ll also find a simple ROI framework, an honest list of implementation mistakes, and a 90-day roadmap. No generic case study. Just evidence you can use to make a real decision.
Why Most Delivery Optimization Success Stories Don’t Tell You What You Actually Need to Know
Most route optimization case studies share three flaws.
First, they cherry-pick one impressive number without context. “40% reduction in mileage” sounds great until you realize the company started with zero routing structure. Your baseline might already be decent.
Second, they hide the transition. Nobody mentions the two weeks of driver confusion, the manager who had to re-optimize routes by hand because the team resisted the new app, or the customer complaints during rollout.
Third, they rarely segment by fleet size or industry. A 5-driver courier service and a 150-driver distribution fleet face completely different challenges. Cost per stop, driver turnover, and customer expectations vary widely between a food delivery operation and a field service business. For a deeper look at how different industries measure success, see these route optimization case studies with real ROI data.
According to the American Transportation Research Institute’s operational costs report, fuel and driver wages together account for over 60% of total fleet operating costs. That means even small percentage improvements in routing efficiency can translate into real dollars. But the size of that impact depends heavily on your starting point, fleet size, and industry.
This guide addresses all three gaps. Real numbers. Real timelines, including what went wrong. Segmented by the factors that actually matter.
Success Stories by Fleet Size: Small (5-15 Drivers), Mid-Size (20-50 Drivers), and Large (50+ Drivers) Operations
Fleet size changes what “success” looks like. Here’s what results tend to look like at each stage.
Small Fleets (5-15 Drivers)
A regional courier service running 8 drivers was manually planning routes each morning using a spreadsheet and Google Maps. The owner spent roughly 90 minutes daily building routes by hand, often missing time-sensitive pickups.
After switching to automated route planning, that daily planning time dropped to under 15 minutes. Drivers completed 2-3 more stops per shift without added hours. Fuel spending fell by an estimated 12% within the first month, based on mileage tracking before and after the switch.
For small fleets, the biggest win usually isn’t fuel. It’s owner time. Zeo Route Planner’s AI-powered route optimization saves 2+ hours daily, which for a small operator often means the difference between planning routes at 6 a.m. and actually sleeping through the night.
Mid-Size Fleets (20-50 Drivers)
A regional e-commerce fulfillment company with 35 drivers struggled with inconsistent delivery windows and rising customer complaints about late arrivals. Dispatchers were manually assigning stops based on driver familiarity with neighborhoods, not efficiency.
After implementing time-window based routing and live ETA updates, on-time delivery rates improved from around 78% to 94% over eight weeks. Customer service tickets related to “where’s my order” calls dropped by nearly a third, since customers could track live ETAs instead of calling dispatch. This kind of communication improvement also plays directly into broader customer retention strategies for delivery-based businesses.
Mid-size fleets typically see the most dramatic gains in customer communication. Live tracking links and automated SMS notifications remove a huge chunk of manual dispatcher workload.
Large Fleets (50+ Drivers)
A multi-region distribution company running 120+ drivers across three warehouses needed skill-based assignment and capacity-based routing to handle mixed vehicle types and delivery requirements. Manual dispatch was taking two dispatchers nearly four hours each morning.
After rolling out automated, capacity-aware routing, planning time dropped to under 45 minutes across all three regions. Driver utilization improved enough that the company delayed a planned fleet expansion by six months, avoiding the cost of two additional vehicles and drivers.
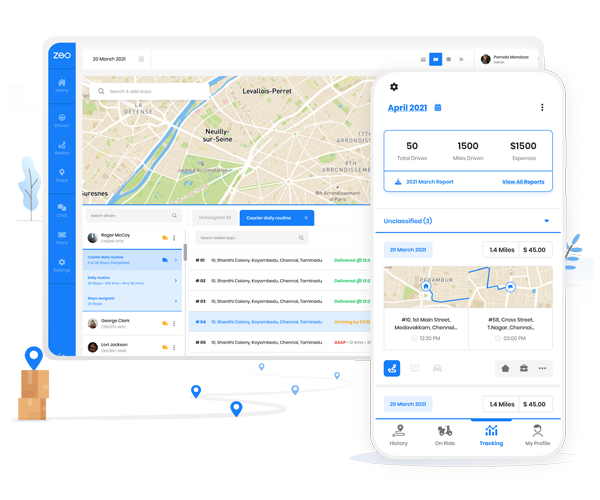
At this scale, managers plan and assign routes from the web dashboard, and drivers receive them instantly through the Zeo mobile app for turn-by-turn navigation and proof of delivery. That handoff matters more as fleets grow. A dispatcher can build a perfect route, but if drivers aren’t actually using the app to follow it, the optimization never reaches the road. This is where reliable driver tracking software becomes essential for confirming routes are actually being followed in real time.
Industry Breakdown: How Couriers, Grocery Delivery, Field Service, and Distribution Fleets Each Measure Success Differently
Not every industry measures “success” the same way. Here’s how the metrics shift.
Couriers and last-mile delivery care most about stops per hour and on-time rate. A same-day courier service typically tracks how many deliveries a driver completes per shift and how often they miss promised delivery windows. Priority stop features, which let dispatchers flag ASAP deliveries versus standard ones, directly impact this metric.
Grocery and food delivery live and die by speed and freshness perception. Customers expect accurate ETAs down to the minute. Live ETA updates and branded tracking pages matter more here than in almost any other category, since a wrong ETA on a grocery order creates immediate customer frustration.
Field service businesses (HVAC, pest control, plumbing, landscaping) measure success in jobs completed per technician per day, not just miles driven. Skill-based assignment matters because you can’t send a pool cleaning technician to an electrical inspection. A pest control company with 25 technicians, for example, cares more about matching the right tech to the right job type than shaving a few miles off a route.
Distribution fleets focus on cost per delivery and vehicle utilization. Capacity-based routing, which accounts for vehicle weight and volume limits, prevents the common problem of trucks running half-empty on one route while another gets overloaded.
The U.S. Bureau of Labor Statistics projects continued growth in delivery driver employment through 2032, driven largely by e-commerce demand. That growth means more competition for driver hours and vehicle capacity, which makes industry-specific metrics more important, not less.
Manual vs. Optimized Routing: A Visual Before-and-After Comparison
Picture a 12-stop delivery route across a mid-sized city.
Manual routing typically looks like this: a dispatcher orders stops by memory or by the order customers called in, not by geography. The route zigzags across town, crossing back over the same streets multiple times. A driver covering 45 miles might only need to cover 30 if the stops were sequenced logically. This is one of the most common causes behind rising last-mile delivery costs, and often the easiest to fix.
Optimized routing groups stops geographically and factors in time windows, traffic patterns, and priority flags. The same 12 stops get sequenced into a loop that minimizes backtracking. In side-by-side comparisons run by fleet managers testing Zeo Route Planner, routes that previously took 6.5 hours dropped to 5 hours for the same stop count.
Here’s the pattern that shows up consistently across manual vs. optimized comparisons:
- Mileage: Manual routes average 15-25% more miles for identical stop counts
- Drive time: Optimized routes reduce total drive time by cutting backtracking and redundant turns
- Fuel cost: Lower mileage directly reduces fuel spending, which the U.S. Energy Information Administration notes remains one of the top three variable costs for commercial fleets
- Driver stress: Drivers report less confusion when routes follow a logical geographic sequence instead of a call-order list
The visual difference is obvious on a map. Manual routes look like scribbles. Optimized routes look like clean loops. That difference translates directly into miles, time, and money.
Calculate Your Own Savings Potential: A Simple ROI Framework
Skip the guesswork. Here’s a framework you can run with your own numbers in under 10 minutes.
Step 1: Calculate your current cost per mile.
Add fuel, maintenance, and driver wages for one month. Divide by total miles driven that month. If you’re unsure how to build this calculation, this guide to cost per mile breaks down what to include.
Step 2: Estimate your mileage reduction.
Based on the comparisons above, a realistic estimate for fleets currently using manual or semi-manual routing is 10-20% mileage reduction after optimization.
Step 3: Multiply your monthly mileage by that percentage.
If your fleet drives 20,000 miles a month and you save 15%, that’s 3,000 miles saved monthly.
Step 4: Multiply saved miles by your cost per mile.
If your cost per mile is $1.10 (a common average factoring fuel and wear), that’s $3,300 saved monthly, or roughly $39,600 annually.
Step 5: Add time savings.

increase fuel savings
Save 2 Hours on Deliveries, Everyday!
Optimize routes with our algorithm, reducing travel time and costs efficiently.
Get Started for Free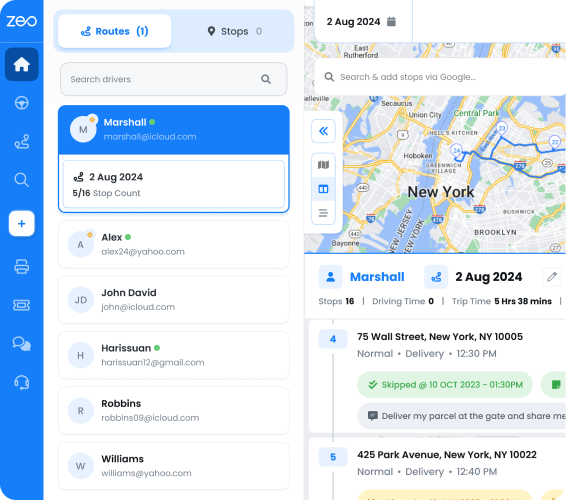
If route planning currently takes a manager or dispatcher 60-90 minutes daily, and optimization software cuts that to 10-15 minutes, calculate that time at their hourly rate and multiply by working days per month.
Step 6: Factor in driver capacity gains.
If optimized routing lets each driver complete 2-3 additional stops per day without added hours, calculate what those extra stops are worth in revenue or reduced need for new hires.
This isn’t a guaranteed outcome for every fleet. Results depend on how inefficient your current routing is to start. But fleets with little to no existing route structure tend to see savings on the higher end of these ranges, while already-efficient operations see more modest gains.
Common Pitfalls That Sabotage Route Optimization Rollouts (and How to Avoid Them)
Route optimization software fails in specific, predictable ways. Here’s what to watch for.
Pitfall 1: Skipping driver buy-in.
Managers plan the perfect route on the dashboard, but drivers ignore it and revert to their own habits. Fix this by training drivers on the mobile app before full rollout, and explain what’s in it for them: fewer hours on the road, clear turn-by-turn navigation, and less guesswork on tricky addresses.
Pitfall 2: Poor address data.
Bulk importing a messy customer address list full of typos and missing unit numbers creates bad routes no matter how good the algorithm is. Clean your address data first. Zeo’s bulk import supports Excel, CSV, and Google Sheets, but the software can only optimize the data you give it.
Pitfall 3: Ignoring time windows and constraints.
Some managers set up optimization without accounting for customer time windows, driver break requirements, or vehicle capacity limits. The result is a mathematically efficient route that’s operationally impossible.
Pitfall 4: Trying to switch the entire fleet overnight.
Rolling out to 100 drivers on day one, with no pilot group, multiplies any early mistakes. Start with one region or one shift.
Pitfall 5: Not tracking a baseline before switching.
If you don’t know your current cost per mile, on-time rate, or stops per driver, you can’t prove the switch worked. Measure before you optimize.
Pitfall 6: Underestimating the app adoption curve.
Drivers who’ve used the same navigation habits for years need a week or two to trust a new tool. Real-time GPS tracking and live status updates only generate value if drivers actually open the app and follow it.
Your 30-60-90 Day Roadmap to Replicating These Results
Days 1-30: Foundation
Clean your address database and import it using bulk upload. Set up driver profiles, including vehicle capacity, skills, and work hours. Run a pilot with one team or region rather than the full fleet.
During this phase, managers plan routes on the web dashboard while drivers get comfortable receiving optimized routes on the Zeo mobile app, complete with turn-by-turn navigation and customer details. This is where most of the friction from Pitfall 1 and Pitfall 6 shows up, so budget extra time for driver training here.
Days 31-60: Expansion
Roll out to the rest of your fleet, region by region. Turn on customer notifications (SMS, email, live tracking link) to start reducing “where’s my delivery” calls. Begin collecting proof of delivery through photo capture and digital signatures to cut down on delivery disputes.
Track your baseline metrics weekly: cost per mile, on-time rate, stops per driver, and planning time. Compare against your pre-optimization numbers from Step 1 of the ROI framework.
Days 61-90: Optimization and reporting
Turn on skill-based assignment if you have technicians or drivers with specialized capabilities. Set up recurring routes for regular customers or scheduled stops to save additional planning time. Use route analytics and reporting to identify which regions or drivers are still running inefficient routes, and adjust.
By day 90, you should have a full 60-day dataset comparing pre- and post-optimization performance, enough to calculate real ROI instead of estimating it.
Companies that follow a phased rollout like this, rather than an all-at-once switch, consistently report smoother adoption and fewer driver complaints in the first month. The goal isn’t a perfect launch. It’s a fleet that’s measurably better by day 90 than it was on day one.
Frequently Asked Questions
Q: What counts as a good ROI timeline for delivery route optimization?
Most fleets see measurable results within 30-60 days, with full ROI data available by day 90 once a complete before-and-after dataset exists. Small fleets often see faster payback since manual planning time savings show up immediately, while larger fleets need longer to account for phased rollouts across regions.
Q: How much can a small delivery fleet realistically save by switching to route optimization software?
Based on documented small-fleet cases, daily route planning time can drop from 60-90 minutes to under 15 minutes, and fuel spending can fall by roughly 10-15% within the first month. The exact savings depend on how inefficient the manual process was beforehand, so fleets with little existing structure tend to see the largest gains.
Q: What’s the difference between a route optimization case study and a real success story with proof?
A real success story includes a documented baseline (cost per mile, on-time rate, planning time) measured before the switch, plus specific numbers after implementation, not just a single flattering statistic. Zeo Route Planner’s route analytics and reporting feature lets fleet managers track these baseline and post-switch metrics themselves rather than relying on someone else’s case study.
Q: Do delivery drivers need training before switching to a new route optimization app?
Yes. Most rollout failures happen when drivers aren’t trained before launch and simply revert to their old habits instead of following the optimized route. A one-to-two week adjustment period with hands-on training, ideally starting with a pilot group, significantly reduces the confusion and resistance that derails many rollouts.
Q: How do I know if my fleet’s routing inefficiency is big enough to justify switching software?
If you don’t currently track cost per mile, on-time delivery rate, or daily stops per driver, that’s usually the first sign there’s room for improvement. Fleets using manual or spreadsheet-based routing typically drive 15-25% more miles than necessary for the same stop count, which is a measurable gap that route optimization software with capacity-based and time-window routing, like Zeo Route Planner, is built to close.
—
If you’re managing a delivery or field service fleet and want to see these numbers against your own data, start a free Zeo Route Planner trial and run your fleet through the ROI calculator to see projected savings before switching. Or book a live demo to walk through a rollout plan built around your specific fleet size and industry.
Are you a fleet owner?
Want to manage your drivers and deliveries easily?
Grow your business effortlessly with Zeo Routes Planner – optimize routes and manage multiple drivers with ease.
increase fuel savings
Save 2 Hours on Deliveries, Everyday!
Optimize routes with our algorithm, reducing travel time and costs efficiently.
Get Started for Free