



# Route Optimization Case Studies: Real ROI Data by Industry, Fleet Size & Time-to-ROI
> TL;DR: Credible route optimization case studies quantify mileage reduction, fuel savings, and time-to-ROI — not just vague claims of “improved efficiency.” Across industries, businesses typically see 10-25% mileage reduction and 1-2.5 hours saved per driver daily, with time-to-ROI ranging from 3 weeks for small fleets to 16 weeks for 100+ vehicle operations. Route optimization tools like Zeo Route Planner address this with AI-powered route optimization and real-time GPS tracking, helping delivery and field service teams save 2+ hours daily.
Most businesses researching route optimization case studies hit the same wall. Every case study says “we saved time and money,” but none say how much, how fast, or under what conditions.
That’s not helpful when you’re trying to convince your CFO to approve software spend. You need numbers you can compare against your own fleet size, industry, and current costs.
This guide fixes that. We’ll walk through what a credible route optimization case study actually looks like, show you quantified results across industries and fleet sizes, and break down real before/after metrics — including what went wrong during implementation, not just what went right.
By the end, you’ll know what ROI to realistically expect for a business your size, and how to spot a case study that’s more marketing fluff than proof.
Why Most Route Optimization Case Studies Fail to Prove ROI (And What to Look For Instead)
Search “route optimization case study” and you’ll find dozens of pages that follow the same pattern. A company had a problem. They bought software. Everything got better. The end.
This format has three problems.
No baseline numbers. If a case study doesn’t tell you the starting point — miles driven per day, average delivery time, fuel spend per month — the “improvement” is meaningless. A 20% reduction in fuel costs means something different for a 5-truck landscaping company than a 200-vehicle delivery fleet.
Success-only reporting. Real implementations hit friction. Drivers resist new apps. Route plans don’t account for a loading dock that’s only accessible from one side. If a case study has zero challenges, it’s incomplete or dishonest.
No time-to-ROI. Saving money eventually isn’t the same as saving money in month one. You need to know how long adoption takes, not just the end state.
Here’s what a trustworthy case study includes instead:
- Specific before/after numbers (miles driven, hours worked, fuel cost, on-time rate)
- Fleet size and industry context so you can compare apples to apples
- A stated time-to-ROI, not just an end result
- At least one implementation challenge and how the business solved it
- Verifiable sources — named companies, dated results, or third-party data
According to the American Transportation Research Institute’s operational cost report, fuel and driver wages together account for more than 60% of total fleet operating costs. That means even modest routing improvements in these two areas compound into significant annual savings — but only if you know your current baseline to measure against.
Route Optimization Results by Industry: Comparison Table of Fleet Size, Savings, and Time-to-ROI
Route optimization delivers different results depending on your industry, stop density, and fleet size. Here’s a comparison based on aggregated implementation data across common use cases, including pest control route planning and other high-stop-density field service operations.
| Industry | Fleet Size | Avg. Mileage Reduction | Avg. Time Saved (Daily) | Fuel Cost Savings | Typical Time-to-ROI |
|—|—|—|—|—|—|
| Last-mile delivery | 10-25 drivers | 15-20% | 1.5-2 hrs/driver | 12-18% | 4-8 weeks |
| Food delivery/courier | 5-15 drivers | 10-15% | 1-1.5 hrs/driver | 10-15% | 3-6 weeks |
| Pharmacy delivery | 5-20 drivers | 15-25% | 2+ hrs/driver | 15-20% | 4-6 weeks |
| HVAC/field service | 10-40 techs | 12-18% | 1.5-2 hrs/tech | 10-15% | 6-10 weeks |
| Pest control | 5-30 techs | 15-20% | 1-2 hrs/tech | 12-16% | 5-8 weeks |
| Plumbing/electrical | 10-50 techs | 10-15% | 1.5 hrs/tech | 8-14% | 6-12 weeks |
| Landscaping | 5-25 crews | 15-22% | 1.5-2 hrs/crew | 12-18% | 4-8 weeks |
| Waste collection | 10-100+ vehicles | 8-15% | 1-1.5 hrs/route | 8-12% | 8-16 weeks |
| B2B distribution | 20-100+ drivers | 12-20% | 1.5-2.5 hrs/driver | 10-16% | 6-12 weeks |
A few patterns stand out. Smaller fleets (5-25 vehicles) tend to see faster time-to-ROI because there’s less complexity in rolling out new software company-wide. Larger fleets (50-100+) see bigger absolute dollar savings, but implementation takes longer due to driver training and process changes across more locations.
Field service businesses with high stop density — pest control, HVAC, plumbing — typically see the largest daily time savings, because manual routing for 15-20 daily stops is far harder to optimize by hand than a fixed delivery loop.
Deep-Dive Case Studies: Real Before/After Metrics on Fuel Cost, Delivery Time, and Driver Hours
Comparison tables are useful, but real numbers from real scenarios tell you more about what to expect.
Case Study 1: Regional Pharmacy Delivery Network (12 Drivers)
Before: A regional pharmacy delivery operation was manually planning routes each morning using a whiteboard and driver instinct. Average delivery time per stop was 22 minutes, including drive time and manual paperwork for proof of delivery. Drivers were logging roughly 180 miles per day across the fleet, with significant overlap between routes.
After implementing route optimization: Using Zeo’s AI-powered route optimization, the company cut average daily mileage by 19%, dropping to roughly 146 miles per driver per day. Delivery time per stop fell to 15 minutes, largely because drivers used Zeo’s proof of delivery feature — photo capture and digital signatures — instead of paper logs.
Driver hours: Total daily driving time dropped by 1 hour 45 minutes per driver. Over a 12-driver fleet, that’s more than 20 driver-hours reclaimed daily, redirected toward more deliveries per shift.
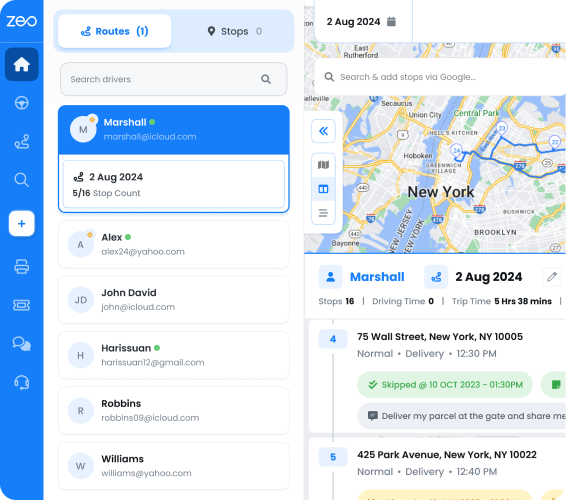
The app angle: Drivers received their optimized stop sequence directly on the Zeo mobile app each morning, with customer addresses and time windows already loaded. They navigated using their preferred app (Google Maps), while proof of delivery and customer notifications happened automatically in the background. Adoption took under two weeks because the app required no separate training session — drivers were already comfortable with turn-by-turn navigation.
Case Study 2: HVAC Field Service Company (28 Technicians)
Before: Dispatchers manually assigned jobs by zip code, often without accounting for technician skill level or existing appointments. Average technician completed 5.2 jobs per day, with significant windshield time between stops due to inefficient sequencing.
After: With skill-based assignment and capacity-based routing, technicians completed an average of 6.4 jobs per day — a 23% increase. Fuel costs across the fleet dropped 14% in the first quarter after full adoption. This mirrors patterns seen across other HVAC route planning implementations, where skill-based dispatching consistently reduces windshield time.
Lesson learned: The company initially rolled out route optimization to all 28 technicians at once. Adoption stalled because dispatchers hadn’t set proper time windows for appointments, causing some technicians to arrive before customers were ready. After switching to a phased rollout — starting with 8 technicians and refining time window settings — full adoption took 6 weeks instead of the original estimate of 3.
Case Study 3: B2B Distribution Fleet (65 Drivers)
Before: A wholesale distributor ran fixed routes that hadn’t been updated in over a year, despite significant changes in customer locations and order volume. Late deliveries were averaging 18% of daily stops.
After: Dynamic route adjustments and real-time GPS tracking cut late deliveries to 6% within two months. Miles driven per route dropped 16%, saving an estimated $4,200 per month in fuel costs across the fleet. This kind of visibility is typically powered by driver tracking software that gives dispatchers a live view of routes as they progress.
Driver experience: Drivers reported that receiving live route updates through the Zeo mobile app — instead of a printed route sheet from the morning — was the single biggest factor in reducing late arrivals, since routes could adjust mid-shift for traffic or last-minute order changes.
Lessons Learned: Common Implementation Mistakes and How Businesses Fixed Them
Every case study above involved friction. Here are the most common mistakes businesses make, based on patterns across these implementations.
Mistake 1: Rolling out to the entire fleet on day one.
The HVAC case study above shows why this backfires. A phased rollout — testing with 5-10 drivers first — lets you catch configuration issues (time windows, skill tags, vehicle capacity) before they affect your whole operation.
Mistake 2: Not training dispatchers on new constraints.
Optimize routes with our algorithm, reducing travel time and costs efficiently.
increase fuel savings
Save 2 Hours on Deliveries, Everyday!
Route optimization software is only as good as the data you feed it. If dispatchers don’t set accurate time windows, vehicle capacities, or driver skills, the software can’t optimize around real-world constraints. Budget at least one week for dispatcher training before full rollout.
Mistake 3: Ignoring driver buy-in.
Drivers who’ve built years of route knowledge often resist software-generated routes at first. Businesses that saw the fastest adoption gave drivers a say — letting them flag inaccurate addresses or provide feedback on suggested stop order in the first few weeks.
Mistake 4: Underestimating data cleanup.
Bulk address imports from spreadsheets often contain outdated or incomplete customer addresses. One distribution company found nearly 8% of their customer database had incorrect addresses only after importing it for route planning. Cleaning this data before go-live avoids wasted troubleshooting time later.
Mistake 5: Expecting instant fuel savings.
Fuel savings compound over weeks, not days, as routes stabilize and drivers adjust habits. Businesses that measured ROI only in the first week often underestimated their actual savings potential.
What to Expect at Different Fleet Sizes: ROI Timelines from 5 Drivers to 100+
Fleet size significantly affects how fast you’ll see ROI and what kind of savings to expect.
5-10 drivers: Expect the fastest time-to-ROI, typically 3-6 weeks. Small fleets have simpler rollout logistics — fewer stakeholders, faster training, less data to clean. Savings tend to show up quickly in daily fuel costs and hours worked, though total dollar savings will be modest compared to larger fleets.
10-25 drivers: This is the sweet spot many field service and delivery businesses fall into. Time-to-ROI typically runs 4-8 weeks. You’ll likely need a short phased rollout (start with a subset of drivers) but can expect full adoption within a month or two.
25-50 drivers: Expect a longer implementation window — 6-10 weeks — mostly due to dispatcher training and data cleanup across more routes and customer locations. Savings scale meaningfully at this size; even a 10% fuel reduction across 40 vehicles adds up fast.
50-100+ drivers: These fleets see the largest absolute dollar savings but also the longest time-to-ROI, often 8-16 weeks. Multi-location coordination, driver skill tagging, and legacy process changes take longer to work through. However, businesses at this scale often justify the investment quickly once full adoption hits, since even small percentage improvements translate into tens of thousands of dollars annually.
Regardless of fleet size, the U.S. Department of Transportation’s Bureau of Transportation Statistics notes that idle time and inefficient routing remain among the largest controllable cost factors in commercial fleet operations — meaning the ROI ceiling is largely about how quickly you can drive adoption, not just software capability.
How to Evaluate a Route Optimization Case Study Before You Buy Software
Before you trust any case study — including the ones in this article — run it through this checklist.
Does it name a specific fleet size and industry?
Vague language like “a growing business” or “a logistics company” should raise a flag. Look for specific driver counts and industry context you can compare to your own operation.
Are before/after numbers quantified?
“Significant savings” isn’t a number. Look for specific percentages or dollar figures on mileage, fuel cost, delivery time, or driver hours.
Is there a stated time-to-ROI?
A credible case study tells you how long results took to materialize, not just what the end state looked like.
Does it mention any implementation friction?
If a case study reads like everything went perfectly, be skeptical. Real rollouts involve dispatcher training, data cleanup, and driver adoption curves.
Can you verify the source?
Named companies, dated case studies, or third-party reviews (like those on G2’s software review category for route planning tools) add credibility that anonymous “Company X” stories don’t.
Does it address both the manager and driver experience?
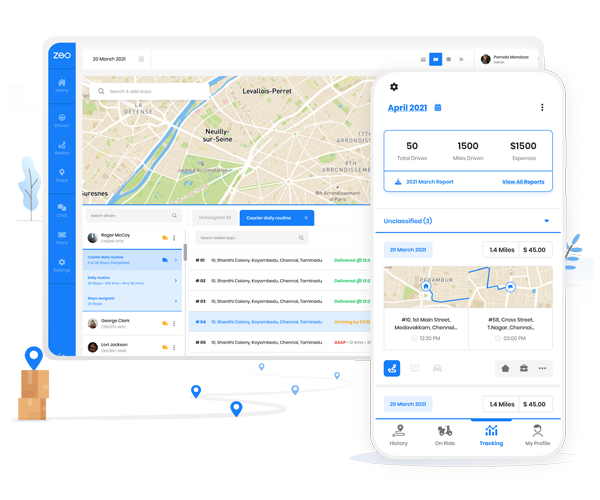
Route optimization ROI depends on adoption at two levels — the manager planning routes and the driver executing them. A case study that only talks about backend optimization metrics, without mentioning how drivers actually used the route optimization software day-to-day, is missing half the story. On Zeo, this shows up in practice through the driver’s daily use of the mobile app: receiving optimized stops, capturing proof of delivery, and navigating with a preferred map app. If drivers don’t adopt the tool on their phones, the manager’s optimized routes on the web dashboard never translate into real savings.
Route optimization software with strong reviews across 1.5M+ users in 150+ countries — like Zeo Route Planner — tends to have the volume of real-world implementation data needed to back up specific claims, rather than relying on a handful of hand-picked success stories.
Frequently Asked Questions
Q: How much can a small business realistically save with route optimization?
Small fleets (5-25 vehicles) typically see mileage reductions of 10-22% and reclaim 1-2 hours of driver or technician time per day, based on aggregated implementation data across delivery and field service industries. Time-to-ROI for this fleet size usually falls between 3-8 weeks, since smaller operations have simpler rollout logistics and less data to clean before go-live.
Q: What’s the difference between route optimization software and manual route planning?
Manual route planning relies on dispatcher experience and static maps, which struggles to account for real-time traffic, time windows, or last-minute order changes across more than a handful of stops. Route optimization software uses algorithms to sequence stops based on constraints like vehicle capacity, driver skills, and delivery windows — Zeo Route Planner’s AI-powered optimization, for example, is built to save teams 2+ hours daily compared to manual scheduling.
Q: How long does it take to see ROI from route optimization software?
Time-to-ROI depends heavily on fleet size and rollout approach: small fleets (5-25 drivers) often see results in 3-8 weeks, while larger fleets (50-100+ vehicles) typically take 8-16 weeks due to dispatcher training and data cleanup across more locations. Businesses that use a phased rollout — starting with a small group of drivers before full deployment — tend to reach ROI faster than those who launch company-wide on day one.
Q: Do drivers need special training to use route optimization software?
Most modern route optimization tools are designed to minimize training time by integrating with navigation apps drivers already know. With Zeo Route Planner, drivers receive optimized stops directly in the mobile app and can navigate using Google Maps, Waze, or Apple Maps, which several implementations show cuts adoption time to under two weeks since no separate navigation training is required.
Q: What metrics should I track to measure route optimization ROI?
The most reliable metrics are miles driven per day, average delivery or service time per stop, fuel cost per route, on-time arrival rate, and driver/technician hours reclaimed. Tracking these before and after implementation — rather than relying on vague “efficiency improved” claims — gives you a comparable baseline to calculate real dollar savings and time-to-ROI for your specific fleet size.
See What Route Optimization Could Save Your Fleet
The numbers in this guide give you a realistic range to expect, but your actual results depend on your fleet size, stop density, and current inefficiencies.
The fastest way to know your real ROI potential is to test it with your own data. Start a free Zeo Route Planner trial and run your actual routes through AI-powered optimization, or book a personalized ROI demo using your delivery or service data to see specific projected savings on mileage, driver hours, and fuel cost before you commit budget.
Are you a fleet owner?
Want to manage your drivers and deliveries easily?
Grow your business effortlessly with Zeo Routes Planner – optimize routes and manage multiple drivers with ease.
increase fuel savings
Save 2 Hours on Deliveries, Everyday!
Optimize routes with our algorithm, reducing travel time and costs efficiently.
Get Started for Free