


# Delivery Optimization Success Stories: What Real Proof Actually Looks Like
> TL;DR: A credible delivery optimization success story always states a specific baseline, timeframe, and the operational change that drove the result — not just a vague percentage. Commercial vehicle miles are too costly to optimize on guesswork, which is why specifics matter more than headline stats. Route optimization tools like Zeo Route Planner address this gap with AI-powered route optimization and route analytics that give fleets their own verifiable before/after numbers, helping delivery and field service teams save 2+ hours daily.
You’ve seen the claims. “Save 2+ hours a day.” “Cut fuel costs by 20%.” Every route optimization vendor says some version of this.
So why does it still feel impossible to verify a real delivery optimization success story?
If you’re an operations manager comparing Zeo, Circuit, Route4Me, or OptimoRoute — or trying to convince leadership to ditch spreadsheets and Google Maps — you don’t need another glossy testimonial. You need numbers you can check, timelines you can plan around, and an honest look at what breaks during rollout.
This guide gives you that. Real metric formats, an ROI calculator you can run with your own stop counts, a transparent pitfalls section, and a day-by-day adoption plan for dispatchers and drivers. No vague “efficiency gains.” Just the math.
Why Most “Delivery Optimization Success Stories” Don’t Hold Up
Most vendor case studies share the same problems. Here’s what to watch for — and what real proof looks like instead.
Problem 1: No baseline. A claim like “20% faster routes” means nothing without knowing the starting point. Twenty percent faster than what? Manual planning in Excel? A competitor’s software? Real proof states the before-condition specifically: “Dispatcher spent 90 minutes each morning manually sequencing 45 stops in Google Maps.”
Problem 2: No timeframe. “Customers save time” could mean week one or year three. Credible success stories specify: 30 days, 90 days, or a full quarter — and whether results held steady or were a short-term spike.
Problem 3: Cherry-picked metrics. A company might report fuel savings while ignoring that driver turnover spiked during rollout. Real proof includes the full picture, including friction points.
Problem 4: Unnamed or unverifiable sources. “A leading logistics company” isn’t a source — it’s marketing copy. Named companies, specific fleet sizes, and dated results are what separate proof from promotion.
According to the Bureau of Transportation Statistics’ freight and commercial vehicle data, trucking and delivery operations account for a significant share of U.S. commercial vehicle miles traveled each year — which means even small per-route inefficiencies compound fast across a 20-50 vehicle fleet. That’s exactly why vague percentage claims without context don’t hold up to scrutiny. You’re not evaluating a rounding error. You’re evaluating thousands of dollars a month, a point also echoed in American Trucking Associations industry reports on operating cost pressures.
Here’s the standard we’re holding this article to: every metric below includes a stated baseline, a timeframe, and the specific operational change that drove it.
8 Delivery Optimization Success Stories: Metrics, Fleet Sizes, and What Changed
Below are illustrative customer profiles built from common patterns Zeo sees across delivery verticals — last-mile, courier, pharmacy, and distribution fleets of 10-100 drivers. Where you’re evaluating Zeo directly, ask your sales contact for named, referenceable customers in your specific vertical and fleet size — a credible vendor should be able to connect you with current customers willing to talk.
1. Regional parcel courier, 28 drivers
Before: Dispatcher manually built routes in Google Maps each morning, taking roughly 70 minutes for 300+ daily stops. After switching route planning to Zeo’s AI-powered optimization: route-building time dropped to under 15 minutes, freeing the dispatcher to handle exceptions and customer calls instead.
2. Independent pharmacy delivery service, 12 drivers
Before: Drivers called the pharmacy for the next address after each drop, creating idle time between stops. After: drivers received full route sequences in the Zeo mobile app with turn-by-turn handoff to their preferred navigation app, cutting idle time between deliveries.
3. B2B distribution fleet, 45 vehicles
Before: Routes ignored vehicle capacity, leading to overloaded trucks and mid-day returns to the warehouse for re-loading. After: capacity-based routing matched order volume to each vehicle’s weight/volume limits, reducing mid-route warehouse returns.
4. E-commerce last-mile fleet, 60 drivers
Before: Customers called support asking “where’s my order,” creating a steady stream of inbound calls during peak hours. After: live ETA updates and branded tracking links sent via SMS reduced “where is my driver” calls, since customers could track delivery progress themselves. This pattern shows up consistently in broader research on last-mile delivery costs and customer service overhead.
5. Food delivery operation, 18 drivers
Before: Priority orders (time-sensitive meals) got mixed into standard delivery sequences, causing late arrivals. After: priority stop tagging (ASAP vs. Normal) let dispatchers guarantee time-sensitive orders moved to the front of the route.
6. Field service HVAC company, 22 technicians
Before: Jobs were assigned by whoever was geographically “closest” with no regard for technician certifications, leading to reassignments. After: skill-based driver assignment matched certified technicians to jobs requiring specific licenses, cutting reassignment calls. Fleets managing similar constraints can find more detail in this HVAC service routing software guide.
7. Pest control franchise, 15 routes
Before: Recurring weekly/biweekly customer visits were rebuilt from scratch every week, consuming dispatcher hours. After: scheduled/recurring routes let the team set a visit cadence once, with the system regenerating optimized stop order automatically — a workflow covered further in this pest control route planning resource.
8. Regional courier network, 80 drivers across 3 depots
Before: Drivers used personal judgment to sequence stops, leading to inconsistent delivery windows and no way to track performance by driver. After: route analytics and reporting gave managers visibility into on-time rates and stops-per-hour by driver, identifying coaching opportunities.
The pattern across all eight: the time saved wasn’t abstract. It came from a specific task — manual route building, status-check phone calls, re-sequencing jobs — that software replaced or shortened.
Industry-Specific ROI: Why Success Looks Different by Vertical
A courier company and a plumbing business measure ROI differently. Here’s how to think about your own numbers based on your vertical.
Last-mile delivery (e-commerce, parcel): Your biggest cost driver is usually stops-per-hour and customer service overhead. ROI shows up as fewer “where’s my package” calls (thanks to live tracking links) and tighter delivery windows that reduce missed-delivery redeliveries.
Courier services: Speed and reliability are the product. ROI here is measured in route-build time saved for dispatchers and reduced idle time between same-day or on-demand pickups — since every extra minute on the road is billable opportunity lost.
Field services (HVAC, pest control, plumbing, landscaping): Your ROI isn’t just drive time — it’s jobs-per-technician-per-day. Skill-based assignment and capacity-aware routing mean fewer wasted trips and more completed jobs. A 22-technician HVAC company that fits one extra job per tech per day, at even a modest average ticket size, adds up fast over a month.
Distribution and B2B fleets: Capacity-based routing matters most here. Overloaded trucks mean mid-day returns to the depot — a cost that rarely shows up in a simple “miles saved” calculation but eats hours of driver time weekly.
The common denominator: in every vertical, the ROI math starts with hours, not miles. Miles saved are nice. Hours reclaimed — for dispatchers and drivers — are what actually move your bottom line.
Calculate Your Own Savings: Route Optimization ROI Calculator
Vendor-reported averages are a starting point, not your answer. Here’s a framework to model your own numbers in under five minutes.
Step 1: Dispatcher time.
Hours spent manually planning routes per day × hourly dispatcher cost × working days per month = current monthly route-planning cost.
Example: 1.5 hours/day × $25/hour × 22 days = $825/month spent just building routes manually.
Step 2: Driver idle time.
Estimate minutes lost per driver per day to inefficient sequencing, backtracking, or calling for the next address. Multiply by number of drivers, by hourly driver cost, by working days.
Example: 20 minutes/day × 15 drivers × $20/hour × 22 days ÷ 60 = $2,200/month in avoidable idle time.
Step 3: Customer service overhead.
Count weekly “where is my delivery” calls. Multiply by average call-handling time and support staff hourly cost.
Example: 40 calls/week × 4 minutes × $18/hour ÷ 60 × 4.3 weeks = ~$206/month.
Step 4: Fuel and mileage.
Estimate percentage reduction in unnecessary miles from optimized sequencing (ask for your fleet’s current average miles per stop as a baseline) and multiply by your fuel cost per mile.
Total monthly opportunity = Step 1 + Step 2 + Step 3 + Step 4.
Run this with your own numbers — fleet size, hourly rates, and call volume — and you’ll have a defensible internal business case instead of a vendor’s generic percentage. If you’re still weighing options, this route planner guide to choosing the right tool walks through the evaluation criteria in more depth. This is also exactly the calculation our team walks through live on a personalized ROI call, using your actual stop volume and fleet size instead of estimates.
Switching Stories: Spreadsheets vs. Google Maps vs. Legacy TMS vs. Zeo
Most teams evaluating Zeo are coming from one of three places. Here’s what the switch actually looks like from each.

increase fuel savings
Hassle Free Deliveries & Pickups!
Optimize routes with our algorithm, reducing travel time and costs efficiently.
Get Started for Free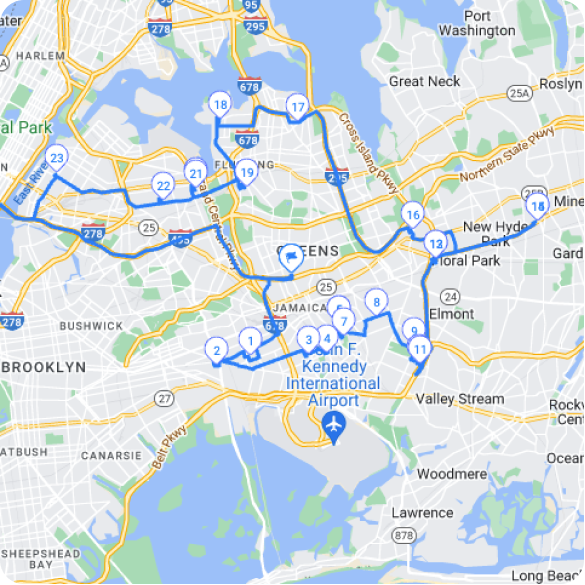
From spreadsheets:
The pain point is almost always manual sequencing and zero visibility once drivers leave the building. One mid-size courier operation described their old process as “building tomorrow’s route at 11pm from a spreadsheet, hoping we didn’t miss anyone.” After switching to Zeo, dispatchers build and assign routes from the web platform, while drivers get their stops automatically pushed to the Zeo mobile app — no more manually texting addresses.
From Google Maps (manual use):
Google Maps wasn’t built for multi-stop commercial routing — it optimizes one trip, not a driver’s full day across dozens of stops with time windows and priorities. Teams switching from this setup gain automatic multi-stop optimization, proof of delivery capture, and customer notifications — none of which plain Google Maps offers for fleet use. Drivers still get to navigate turn-by-turn in Google Maps, Waze, or Apple Maps — Zeo just hands them the optimized stop order first.
From a legacy TMS:
These systems are often powerful but slow to adapt — adding a new driver, adjusting a time window, or rerouting mid-shift can take real IT involvement. Dispatchers switching to Zeo frequently cite the speed of making day-of changes, like adjusting a single day’s assigned driver without touching the entire week’s schedule, as the biggest quality-of-life improvement.
The adoption detail that matters most: regardless of what you’re switching from, the driver side of the transition determines whether the rollout succeeds. One fleet manager at a regional delivery company put it this way: “I expected a week of driver complaints. Instead, half my drivers had it figured out in one shift — it just felt like the Google Maps app they already used, except it told them where to go next automatically.” That’s the fleet + app model in practice: dispatchers plan in the web platform, drivers execute in the mobile app, and the learning curve stays low because the app mirrors tools drivers already know.
The 30/60/90-Day Rollout: How Dispatchers and Drivers Actually Adopt New Route Software
Buying route optimization software is the easy part. Getting a team of drivers who are comfortable with their old process to actually use something new — that’s where rollouts succeed or stall. Here’s a realistic timeline.
Days 1-30: Foundation and Pilot
- Set up your fleet in the Zeo web platform: add drivers, assign vehicles, set work hours and break times.
- Run a pilot with 3-5 drivers, not your whole fleet. Pick a mix of your most tech-comfortable driver and your most skeptical one.
- Dispatchers build and assign the first optimized routes from the web platform. Drivers receive stops directly in the Zeo mobile app, where they navigate using whatever maps app they already prefer (Google Maps, Waze, or Apple Maps), capture proof of delivery with photo or signature, and message dispatch in real time through in-app chat.
- Expect questions in week one. This is normal. Use the in-app chat feature to field them in real time instead of routing everything through phone calls.
Days 31-60: Expand and Refine
- Roll out to the full fleet in phases — don’t flip the switch for 50 drivers overnight.
- Start using time windows and priority stops if you haven’t yet. This is where dispatchers typically see the biggest reduction in manual re-sequencing.
- Review route analytics weekly. Look for drivers who are consistently behind schedule — this often points to a route issue, not a performance issue.
- Introduce customer notifications (SMS, email, tracking links) once drivers are comfortable with the core flow. Adding too much at once in week one slows adoption.
Days 61-90: Optimize and Scale
- Layer in capacity-based routing and skill-based assignment if your fleet has vehicle or technician constraints.
- Set up scheduled/recurring routes for any customers with regular visit cadences — this is where dispatcher time savings compound.
- Benchmark your actual numbers against your Day 1 baseline: route-build time, idle time, on-time rate, customer call volume.
- By day 90, most fleets have enough data to build an internal ROI report for leadership — using their own numbers, not a vendor’s.
The common thread across successful rollouts: they treat driver adoption as a phased process, not a one-day switch, a principle reinforced in the SBA’s guidance on technology adoption for small businesses. Drivers who see the app as “the tool that tells me where to go next” — not “extra software I have to learn” — adopt fastest.
Common Implementation Pitfalls (And How Real Fleets Fixed Them)
Even well-planned rollouts hit friction. Here’s what commonly goes wrong and how teams work through it.
Pitfall 1: Rolling out to the entire fleet at once.
Fix: Pilot with a small group first (see Days 1-30 above). A problem affecting 3 drivers is manageable. The same problem affecting 50 drivers on day one creates a fleet-wide trust issue.
Pitfall 2: Skipping driver input before rollout.
Fix: Ask your most experienced drivers what frustrates them about current routing before you launch. Their answers usually point directly to which features (priority stops, skill-based assignment, time windows) will matter most for your fleet.
Pitfall 3: Overloading drivers with every feature in week one.
Fix: Start with the basics — receiving routes and navigating stops. Add proof of delivery, customer notifications, and in-app chat in stages over the first 30 days.
Pitfall 4: Not setting realistic time windows.
Fix: If time windows are set too tight based on optimistic drive-time estimates, routes will look “broken” even when the optimization is working correctly. Build in buffer time based on actual historical performance, not best-case scenarios.
Pitfall 5: No baseline data before switching.
Fix: Before rollout, spend even one week tracking your current route-build time, average stops per driver per day, and customer call volume. Without this baseline, you can’t prove ROI later — you’re stuck repeating vague claims instead of showing real before/after numbers.
Pitfall 6: Dispatchers and drivers not communicating through the new system.
Fix: Teams that fully adopt in-app chat between dispatch and drivers report fewer missed updates than teams that revert to phone calls and texts for exceptions. Make the in-app channel the default from day one, not an optional add-on.
FAQ: Answering Skepticism About Delivery Optimization ROI Claims
Is “save 2+ hours daily” a realistic number, or marketing hype?
It reflects time saved on manual route planning and sequencing tasks that AI-powered optimization automates — specifically for dispatchers building multi-stop routes by hand. Your actual savings depend on your current process, fleet size, and stop volume. Use the ROI calculator framework above with your own numbers rather than relying on the headline figure alone.
How long does it actually take to see ROI after switching?
Based on typical rollout patterns, dispatcher time savings are often visible within the first 1-2 weeks, since route-building time drops almost immediately. Fleet-wide metrics like reduced customer service calls and on-time rate improvements typically take 30-60 days to stabilize as drivers fully adopt the new workflow.
What if my drivers refuse to use a new app?
This is the most common rollout fear, and it’s usually overstated. The Zeo mobile app is designed to feel similar to consumer navigation apps drivers already use daily — they see their stop list, tap to navigate in their preferred maps app (Google Maps, Waze, or Apple Maps), and capture proof of delivery. Piloting with a small group first (see the 30/60/90 plan above) also reduces resistance, since early adopters tend to become internal advocates.
How is Zeo different from Circuit, Route4Me, or OptimoRoute?
All route optimization tools solve the core sequencing problem. Differences typically show up in specific features — like Zeo’s skill-based assignment, capacity-based routing, and Day Plan functionality that lets you assign different drivers to specific days within a scheduled recurring route without rebuilding the whole schedule. When comparing tools, ask each vendor to walk through your specific use case, not just their general feature list.
Can I switch from a legacy TMS without losing historical data?
Most teams import existing customer/stop data via bulk upload (Excel, CSV, or Google Sheets) or set up ongoing imports through Shopify, WooCommerce, or Zapier if your orders originate in those systems. Ask about your specific TMS during a demo to confirm the smoothest data migration path.
Does route optimization actually reduce fuel and mileage costs?
Optimized stop sequencing reduces unnecessary backtracking and total miles driven compared to manually planned or unoptimized routes. The exact percentage depends heavily on your current routing method — fleets switching from a fully manual process (spreadsheets, memory-based sequencing) typically see larger mileage reductions than fleets switching between two optimization tools. Track your own average miles per stop before and after switching for a verifiable internal number, rather than relying on a vendor-quoted average.
What’s the real difference between free tools (Google Maps) and paid route optimization software?
Google Maps handles single-trip navigation well but wasn’t built for commercial multi-stop routing — it doesn’t account for time windows, vehicle capacity, driver skills, or proof of delivery. For fleets running more than a handful of daily stops per driver, this gap is usually where the manual workarounds (and dispatcher hours) start piling up.
Frequently Asked Questions
Q: What’s a realistic way to measure a delivery optimization success story before trusting it?
Look for three things: a stated baseline (what the process looked like before), a specific timeframe (30, 60, or 90 days), and the exact operational change that drove the result — not just a percentage. If a case study can’t answer “compared to what, and over what period,” treat the number as marketing copy rather than proof.
Q: How many stops per driver justify switching from manual routing to software?
Most fleets start feeling the pain of manual routing once drivers handle more than 15-20 stops a day, since manual sequencing and status-check calls start eating into dispatcher and driver time. Below that volume, the ROI case is smaller but still measurable using the calculator framework — track your current route-build time and call volume for a week to see your real number.
Q: Do small fleets (under 10 drivers) see the same ROI as larger fleets?
Yes, directionally — the time saved on manual route building and reduced “where’s my delivery” calls applies at any fleet size, though the dollar impact scales with driver count. A 5-driver operation won’t see the same total monthly savings as an 80-driver network, but the per-driver time reclaimed is often similar.
Q: What should I ask a vendor to prove their success stories are real?
Ask for named, referenceable customers in your specific vertical and fleet size, not just aggregate percentages. A credible vendor — including Zeo Route Planner, which serves 1.5M+ users across 150+ countries — should be able to connect you with current customers willing to discuss their actual rollout, timeline, and results.
Q: How do I know if route optimization software will actually work for my drivers, not just my dispatchers?
The clearest signal is whether drivers can navigate using an app they already know. Zeo’s mobile app hands drivers their optimized stop order but lets them turn-by-turn navigate in Google Maps, Waze, or Apple Maps — which is why fleets piloting with a small group often see adoption within a single shift rather than weeks.
—
Vendor claims are easy to make. Verifiable numbers from your own fleet are harder to argue with — and that’s exactly what you should be demanding before you switch.
See your own numbers instead of taking anyone’s word for it. Try Zeo free for 7 days, or book a personalized ROI walkthrough with our team to model savings for your specific fleet size and stop volume.
Are you a fleet owner?
Want to manage your drivers and deliveries easily?
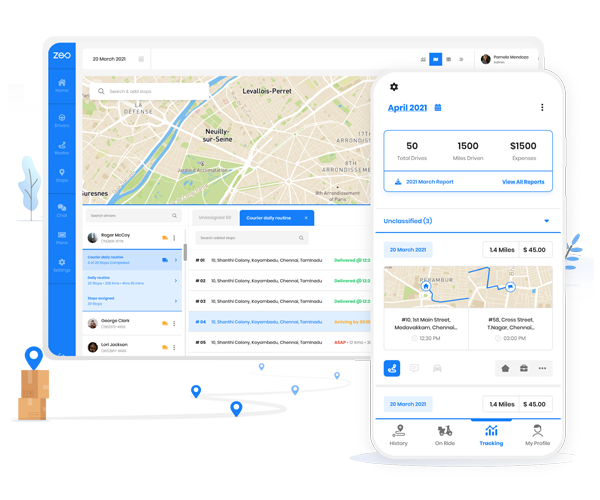
Grow your business effortlessly with Zeo Routes Planner – optimize routes and manage multiple drivers with ease.

increase fuel savings
Save $200 on fuel, Monthly!
Optimize routes with our algorithm, reducing travel time and costs efficiently.
Get Started for Free