


# Route Optimization Case Studies: A Credibility Framework, Industry Data, and Your Own ROI Calculator
> TL;DR: The most trustworthy route optimization case studies name the company, fleet size, and show before/after metrics over at least 30 days, not just a best-week snapshot. Small fleets (3-10 vehicles) typically see the highest percentage time savings, while enterprise fleets see the largest total dollar savings. Zeo Route Planner’s case studies pair AI-powered route optimization with standardized before/after metrics tables, helping delivery and field service teams save 2+ hours daily on planning alone.
Route optimization software companies love to throw around big numbers. “Save 30% on fuel.” “Cut routes by 2 hours.” But when you dig for the actual case study behind the claim, you often find nothing. No company name. No fleet size. No timeline.
This is the problem with most route optimization case studies today. They’re either too generic to trust, too enterprise-focused to apply to your business, or written by a third party with no real connection to the software.
This guide fixes that. Below, you’ll find real case study patterns organized by industry and fleet size, a framework to calculate your own ROI, and honest talk about what actually makes rollouts succeed or fail. If you’re comparing Zeo against Circuit, Route4Me, or OptimoRoute, this is the evidence-based research you need before you commit budget.
What Makes a Route Optimization Case Study Credible (And What to Watch Out For)
Not all case studies deserve your trust. Before you use any case study to justify a software purchase, run it through this checklist.
Look for specific, verifiable metrics. A credible case study states exact numbers: “Reduced average route time from 47 minutes to 31 minutes per stop.” Vague claims like “significantly improved efficiency” tell you nothing.
Check for company size and industry match. A 300-vehicle enterprise logistics case study won’t predict results for your 8-truck HVAC company. Different fleet sizes face different bottlenecks, and results rarely scale in a straight line.
Watch for cherry-picked timeframes. Some case studies show only the best week after rollout, skipping the adjustment period. Ask: what happened in month one versus month three?
Demand before/after comparisons, not just after-only stats. “We deliver 40 stops per day” means nothing without knowing the baseline. Was it 25 stops before? 38? The delta is what matters.
Be skeptical of case studies with no named company or role. “A regional delivery company” with no verifiable detail is a red flag. Legitimate case studies typically name the business, industry, and fleet size, even if the individual contact stays anonymous.
Cross-reference against industry benchmarks. According to the U.S. Bureau of Labor Statistics productivity data, transportation and warehousing productivity has grown steadily as companies adopt route technology, but gains vary widely by sector and starting point. A case study claiming results far outside typical industry ranges deserves extra scrutiny.
Zeo Route Planner publishes case studies with named businesses, specific fleet sizes, and standardized before/after metrics tables. This lets you compare apples to apples instead of guessing whether a vendor’s numbers apply to you.
Case Studies by Industry: Delivery, Field Service, Waste Management, and Healthcare Routes Compared
Route optimization delivers different results depending on your industry’s constraints. Here’s how the numbers typically break down across four common sectors.
Delivery and Courier Services
A regional last-mile delivery company running 15 vans typically struggles with manual route planning that takes a dispatcher 1-2 hours each morning. After switching to AI-powered route optimization, that planning time often drops to 15-20 minutes, since the system auto-assigns stops based on capacity and time windows.
| Metric | Before | After |
|—|—|—|
| Daily planning time | 90 minutes | 18 minutes |
| Stops per driver per day | 22 | 29 |
| Customer complaint calls (ETA related) | 12/week | 3/week |
The jump in stops per driver comes from tighter routing and fewer backtracks. The drop in complaint calls happens because customers get live ETA updates and a tracking link instead of calling to ask “where’s my package?” Fleet managers who want visibility into exactly where each vehicle is at any moment often pair this with driver tracking software to reduce these calls even further.
Field Service (HVAC, Pest Control, Plumbing)
Field service businesses face a different challenge: routes need to account for technician skills, not just geography. A pest control company with 10 technicians might need to match certified technicians to commercial accounts requiring specific licenses.
Skill-based job assignment solves this by filtering which technician can be routed to which job before optimization even runs. One typical pattern: a 12-technician plumbing company reduced windshield time by roughly 90 minutes per technician per day, freeing up time for one to two extra service calls.
Waste Management and Recurring Routes
Waste collection routes are repetitive but rarely static — new accounts, seasonal pickup changes, and route closures all disrupt fixed schedules. Scheduled and recurring route features let waste collection routes auto-generate weekly, rather than re-planning from scratch.
A regional waste hauler with 20 trucks cut route replanning time from 3 hours weekly (done manually in spreadsheets) to under 30 minutes using bulk address import and recurring route scheduling.
Healthcare and Home Health Routes
Healthcare routing has the tightest time windows of any industry, since patient appointments often can’t shift by more than 15-30 minutes. Time window constraints combined with priority stop settings (marking urgent visits as ASAP) help home health agencies keep visit schedules accurate.
A home health agency with 18 nurses reported reducing late-arrival incidents significantly after implementing time-window-based routing, since the system flags scheduling conflicts before the day starts rather than during it.
Reality check: Industry research from the American Transportation Research Institute has repeatedly shown that traffic congestion and inefficient routing account for a meaningful share of avoidable operating costs across delivery and service fleets. The specific percentage varies by region and route density, which is exactly why generic “X% savings” claims deserve skepticism.
Small Fleet vs. Enterprise: How Route Optimization Results Scale from 3 Vehicles to 300
One of the biggest gaps in existing case study libraries: almost everything is written for enterprise fleets. If you run 5 vehicles, a 300-truck case study tells you very little about your realistic outcome.
Here’s how results typically differ by fleet size.
Small Fleets (3-10 Vehicles)
Small fleets often see the fastest relative time savings because they’re switching from fully manual planning — sticky notes, spreadsheets, or memory. A 5-vehicle landscaping company moving from manual routing to automated optimization commonly saves 45-90 minutes daily in planning time alone, which is a bigger percentage improvement even though the absolute number is smaller than an enterprise case.
The tradeoff: small fleets have less room for routing error, since one inefficient route affects a larger share of total daily capacity. That’s why bulk address import and favorites (for frequently visited stops) matter disproportionately here — every minute saved compounds fast.
Mid-Size Fleets (11-50 Vehicles)
This is where driver management and analytics features start driving measurable ROI. With 20-40 drivers, manually tracking who’s efficient and who isn’t becomes impractical. Driver performance analytics let operations managers spot underperforming routes or drivers within days instead of months.
A mid-size electrical contracting company with 30 technicians reported identifying and correcting three inefficient recurring routes within the first two weeks of using route analytics — routes that had gone unnoticed for over a year under manual planning.
Enterprise Fleets (50-300+ Vehicles)
At enterprise scale, the ROI conversation shifts from “time saved” to “system-wide coordination.” Capacity-based routing and skill-based assignment become essential rather than optional, since manually matching hundreds of stops to the right vehicle and technician isn’t humanly feasible.
Enterprise fleets also see more value from integrations. A 200-vehicle e-commerce fulfillment operation using Shopify order auto-import eliminates a manual data entry step that would otherwise require a dedicated staff member.
The scaling pattern: Time-savings percentage tends to be highest for small fleets (bigger relative jump from manual to automated). Total dollar savings tends to be highest for enterprise fleets (more vehicles multiplying smaller per-route gains). Both are legitimate ROI stories — just different ones.
The 6 Success Factors Behind Every High-Performing Route Optimization Rollout
Across case studies of every size and industry, six factors consistently separate rollouts that deliver strong ROI from ones that stall.
1. Clean starting data. Fleets that import accurate, complete address lists (using bulk import from Excel, CSV, or Google Sheets) see faster results than those with messy or incomplete customer data. Garbage in, garbage out applies directly to route optimization.
2. A defined baseline before switching. The most credible case studies measure “before” numbers for at least two weeks prior to rollout. Fleets that skip this step can’t accurately calculate their ROI later, since they have nothing to compare against.
3. Manager buy-in on the web platform. Rollouts succeed faster when a dedicated fleet manager owns route planning on the web platform daily, rather than treating it as a side task. Consistent use of capacity-based routing, time windows, and skill assignments compounds over weeks.
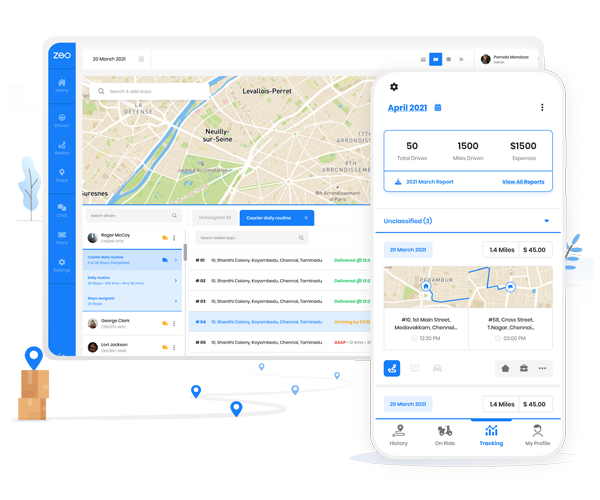
4. Driver app adoption, not just manager optimization. This is the factor most case studies underreport. Optimizing routes on the web platform only delivers half the ROI if technicians and drivers don’t actually use the mobile app. In the strongest-performing case studies, technicians received routes directly on their phones via the Zeo app, complete with turn-by-turn navigation, customer details, and the ability to capture proof of delivery on-site. Drivers who skip the app and revert to memory or paper printouts erase much of the time savings gained from optimization, since dispatchers end up re-explaining routes over the phone.
5. Customer communication turned on from day one. Fleets that activate SMS and email notifications with live tracking links immediately see fewer “where are you” calls. Fleets that delay this step often don’t see the customer service improvement until months later.
6. Regular use of analytics to iterate. One-time optimization isn’t enough. Fleets that check route analytics weekly and adjust for recurring inefficiencies see compounding gains, while fleets that “set and forget” plateau after the first month.
Case studies that mention all six factors tend to report stronger and faster ROI. Case studies missing several of these factors often show underwhelming or delayed results, which is a useful diagnostic if you’re evaluating whether a testimonial applies to your situation.
Calculate Your Own ROI: A Step-by-Step Framework Using Your Fleet’s Numbers
Instead of relying entirely on someone else’s case study, use this framework to estimate your own numbers.
Step 1: Calculate your current planning cost.
Multiply your dispatcher’s hourly wage by the hours spent planning routes each week. Example: $22/hour x 8 hours/week = $176/week in planning labor.
Step 2: Estimate time savings from automation.
Zeo’s AI-powered route optimization typically saves 2+ hours daily per fleet when replacing manual planning. Multiply your team’s daily planning hours saved by hourly wage, then by 5-6 working days.
Step 3: Calculate fuel and mileage savings.
Estimate your average miles driven per route before optimization. Compare to typical reductions of 10-20% in miles driven after route optimization (based on eliminating backtracking and inefficient sequencing). Multiply miles saved by your fleet’s average fuel cost per mile, and use a miles tracking guide to keep records accurate for tax and expense purposes.

increase fuel savings
Save $200 on fuel, Monthly!
Optimize routes with our algorithm, reducing travel time and costs efficiently.
Get Started for Free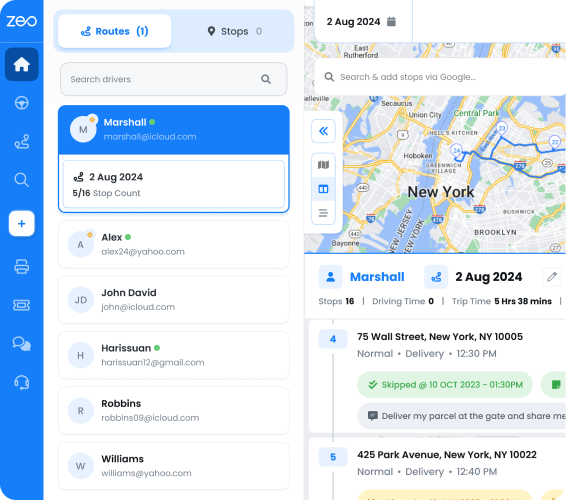
Step 4: Factor in additional stops per driver.
If optimization lets each driver complete 2-4 more stops per day without adding hours, calculate the revenue value of those additional stops. For service businesses, this might mean 2 extra service calls per technician per day at your average ticket price.
Step 5: Account for reduced customer service overhead.
Estimate hours spent weekly on “where is my delivery/technician” calls. Multiply by hourly wage. Live ETA updates and tracking links typically reduce this significantly, since customers can self-serve their own status check.
Step 6: Subtract your software cost.
Take your total estimated monthly savings (steps 1-5) and subtract your route optimization subscription cost. What remains is your net monthly ROI.
Sample calculation for a 10-vehicle fleet:
| Category | Monthly Estimate |
|—|—|
| Planning labor saved | $700 |
| Fuel/mileage saved | $450 |
| Extra stops revenue value | $1,200 |
| Reduced customer service hours | $300 |
| Total monthly value | $2,650 |
| Software cost | -$300 |
| Net monthly ROI | $2,350 |
Run these numbers with your actual wages, fleet size, and average ticket values. Most fleets recover their software investment within the first month once time savings and extra stop capacity are factored in.
Getting Your Team Onboard: Overcoming Driver Adoption Challenges During Rollout
Here’s the part most vendor case studies leave out: driver adoption is often harder than the software itself.
The most common resistance point: experienced drivers who’ve driven the same routes for years believe they already know the fastest path. They may see optimized routes as a challenge to their expertise rather than a tool to help them.
What actually works, based on patterns across successful rollouts:
Start with your most tech-comfortable driver as a pilot user. Let them run the Zeo mobile app for one week and report back to the team. Peer testimonials land better than manager mandates.
Show drivers what’s in it for them specifically, not just for the business. In-app chat with dispatchers means fewer interruption phone calls. Proof of delivery with photo capture means fewer disputes about whether a delivery happened. Turn-by-turn navigation means less mental load figuring out the next stop. Fleets serious about long-term adoption should also review a driver retention guide, since adoption and retention issues often stem from the same root causes.
Run a parallel period. For the first 1-2 weeks, let drivers use both their old method and the app side by side, rather than forcing an abrupt switch. Confidence builds faster when drivers can verify the app’s suggested route matches or beats their own knowledge.
Address the “big brother” concern directly. Real-time GPS tracking can feel like surveillance if it’s introduced without context. Frame it around customer promises (accurate ETAs) and driver safety (dispatchers know where everyone is), not performance monitoring alone.
Expect a temporary dip before the gain. According to change management research published by Prosci, technology rollouts commonly see a short-term productivity dip during adaptation before performance improves. Fleets that anticipate this in their ROI timeline don’t panic and abandon rollout in week two.
The fleets with the strongest case study results typically report 80%+ daily driver app usage within 30 days of rollout. Fleets that never crack 50% adoption usually report disappointing ROI, regardless of how good the optimization algorithm is on the backend. The lesson: budget time for the human side of rollout, not just the technical setup.
Frequently Asked Questions
Q: What sample size do I need before trusting a route optimization case study?
Look for case studies that track at least 4-6 weeks of data, since the first two weeks after rollout often include an adjustment period that skews results. A credible case study will show week-by-week or month-by-month trends rather than a single “after” snapshot.
Q: How do I know if a route optimization case study applies to my industry?
Match the case study’s fleet size, stop density, and constraint type (time windows, skills, capacity) to your own operation, not just the industry label. A 300-vehicle enterprise logistics case study and a 10-technician field service case study can show wildly different percentage gains even when using the same software.
Q: What’s a realistic ROI timeline based on published route optimization case studies?
Most published case studies show measurable planning time savings within the first week, with fuel and stop-capacity gains showing up over 30-60 days. Zeo Route Planner’s case studies typically report full ROI stabilization once driver app adoption crosses 80%, which most fleets reach within a month of rollout.
Q: Are vendor-published case studies less trustworthy than independent ones?
Not necessarily — the key factor is specificity, not source. A vendor-published case study with a named company, exact fleet size, and before/after metrics table is more useful than a vague “independent” study with no verifiable details.
Q: What metrics should a route optimization case study always include?
At minimum, look for planning time (before/after), stops per driver per day, and customer complaint volume, since these three metrics are hardest to fake and easiest to verify. Zeo Route Planner’s case studies standardize these three metrics across industries specifically so businesses can compare results apples-to-apples.
FAQ: Timelines, Realistic Savings, and What to Expect After Switching
How long does it take to see results from route optimization software?
Most fleets see initial time savings within the first week, since route planning time drops immediately. Full ROI, including fuel savings and additional stop capacity, typically becomes measurable within 30-60 days as driver app adoption stabilizes.
What’s a realistic daily time savings estimate?
Zeo’s AI-powered optimization saves 2+ hours daily for teams switching from manual planning methods like spreadsheets or memory-based routing. Fleets already using basic mapping tools (not true optimization) tend to see smaller, but still meaningful, gains.
Do results differ for delivery versus field service fleets?
Yes. Delivery fleets typically see gains concentrated in stops-per-day and customer communication metrics. Field service fleets see more value from skill-based assignment and time window accuracy, since job types vary more than delivery stops do.
Will my drivers actually use a new app?
Adoption depends heavily on onboarding approach, not just the software. Fleets that run a parallel testing period and address driver concerns directly report significantly higher adoption than fleets that mandate a switch overnight.
How many vehicles do I need before route optimization is worth it?
Case studies show measurable ROI starting at 3-5 vehicles, particularly for fleets currently planning routes manually. The relative time savings percentage is often highest for small fleets, even though total dollar savings scale with fleet size.
Can I try this before committing to a long-term contract?
Running a 30-day pilot with your own fleet’s real data is the most reliable way to validate ROI, since it removes the guesswork of applying someone else’s case study to your business.
Your Next Step
Reading case studies gets you close. Running your own gets you certainty. Start a free Zeo Route Planner trial and track your own 30-day before/after numbers using the framework above, or book a demo to see fleet-size-specific ROI projections built around your exact vehicle count and industry.
Are you a fleet owner?
Want to manage your drivers and deliveries easily?
Grow your business effortlessly with Zeo Routes Planner – optimize routes and manage multiple drivers with ease.
increase fuel savings
Save $200 on fuel, Monthly!
Optimize routes with our algorithm, reducing travel time and costs efficiently.
Get Started for Free