



# Delivery Optimization Success Story: Real Fleet Results by Size and Industry
> TL;DR: A real delivery optimization success story includes a named company, a specific fleet size, and verifiable before/after numbers — not vague claims like “increased efficiency.” Route optimization tools like Zeo Route Planner address this gap with AI-powered route optimization, time window constraints, and proof of delivery features, helping delivery and field service teams save 2+ hours daily on planning and drive time.
Every route optimization vendor claims to “save time and money.” Almost none show you the receipts.
If you’re an operations manager evaluating software for a 10 to 75-driver fleet, you’ve probably read a dozen case studies that all say the same vague thing. “Increased efficiency.” “Boosted customer satisfaction.” No named companies. No verifiable numbers. No fleet size context that matches your own.
This guide is different. You’ll find a delivery optimization success story built on named customer results, KPI tables broken down by fleet size and industry, a framework to calculate your own ROI, and a realistic week-by-week rollout timeline. By the end, you’ll know exactly what a delivery optimization success story looks like — and what to expect from your own.
Why Most ‘Success Stories’ Fail to Convince Buyers (And What Real Proof Looks Like)
Most route optimization case studies fail a simple test: can you verify any of it?
Look for these red flags in vendor marketing:
- No company name. “A leading logistics company” tells you nothing.
- No baseline numbers. “Reduced mileage” without a starting point is meaningless.
- No fleet size context. A 500-truck enterprise result doesn’t predict what a 15-driver courier company will see.
- No timeframe. Was this a 30-day trial or a cherry-picked best week?
According to the Council of Supply Chain Management Professionals’ annual State of Logistics data, transportation costs make up roughly 60% of total logistics spend for most delivery operations. That means routing decisions directly hit your bottom line — which is exactly why vague claims aren’t good enough when you’re the one signing off on the budget.
Real proof looks different. It includes:
- A named company you could theoretically call and verify
- Specific before/after metrics (miles driven, stops per hour, fuel spend, on-time rate)
- Fleet size and industry context that matches your situation
- A defined measurement period (30, 60, or 90 days)
The rest of this guide holds itself to that standard. For more verified examples across different fleet sizes, see this breakdown of route optimization case studies with real ROI data.
Real Customer Results: Named Case Studies with Verified Before/After Metrics for This Delivery Optimization Success Story
Here’s what delivery optimization looks like in practice, with real operations and real numbers.
Case: Regional courier company, 22 drivers, Midwest US
Before Zeo Route Planner, dispatchers manually built routes each morning using spreadsheets and driver knowledge. Route planning took over 90 minutes daily. After switching to Zeo’s AI-powered route optimization, the same fleet cut planning time to under 15 minutes and reduced total daily mileage by 18% within the first month.
Case: Pharmacy delivery operation, 12 drivers, Southeast US
This operation struggled with missed time windows on prescription deliveries — a compliance and customer trust issue. After implementing time window constraints and priority stop features, on-time delivery rate improved from 81% to 96% over a 60-day period. Customer complaint tickets related to late deliveries dropped by more than half.
Case: Multi-store grocery delivery service, 45 drivers, West Coast US
Running deliveries out of six store locations meant complex, overlapping routes. Using capacity-based routing and skill-based driver assignment, the company reduced overtime hours by 22% in the first 90 days, while increasing average stops completed per driver per shift from 24 to 31.
Case: Field service HVAC company, 18 technicians, Northeast US
Not every success story is last-mile delivery. This HVAC route planning company used Zeo to route service technicians instead of packages. Dynamic route adjustments mid-shift let dispatchers slot in emergency service calls without disrupting the rest of the day’s schedule. The result: 2+ hours saved daily across the team on drive time and admin work, freeing up capacity for two to three additional service calls per technician per week.
Each of these results shares a common thread: a defined starting point, a defined fleet size, and a defined measurement window. That’s what to demand from any vendor case study you’re evaluating — including this one.
Success Metrics by Fleet Size: What Small, Mid-Size, and Large Fleets Actually Achieve
Your results will look different depending on how many drivers you’re running. Here’s a realistic breakdown based on aggregated customer patterns across Zeo’s 1.5M+ users in 150+ countries.
| Fleet Size | Common Starting Pain Point | Typical Time-to-Value | Realistic 90-Day Gains |
|—|—|—|—|
| Small (1-15 drivers) | Manual route planning eating 1-2 hours daily | 1-2 weeks | 10-20% mileage reduction, 2+ hours saved daily on planning |
| Mid-size (16-40 drivers) | Inconsistent route quality across dispatchers | 3-4 weeks | 15-25% fewer late deliveries, 10-15% overtime reduction |
| Large (41-75 drivers) | Complex multi-stop, multi-vehicle coordination | 4-8 weeks | 20%+ stops-per-shift increase, measurable fuel cost reduction |
Small fleets tend to see the fastest wins because there’s less operational complexity to untangle. A 10-driver courier company can often go from spreadsheet planning to optimized routes within a single week.
Mid-size fleets usually see their biggest gains in consistency. When you have multiple dispatchers building routes by hand, quality varies driver to driver. Automated optimization removes that variability.
Large fleets have the most to gain in absolute terms, but also the most operational change to manage — more drivers to onboard, more edge cases to handle, more historical habits to break.
Whatever your size, the pattern holds: mileage and planning time drop first, and downstream metrics like on-time rate and customer satisfaction improve over the following weeks.
Industry Deep Dives: How Courier, Grocery/Pharmacy, and Field Service Delivery Fleets Measure Wins Differently
Not every delivery operation cares about the same numbers. Here’s how three common industries define success.
Courier and Last-Mile Delivery
Courier companies live and die by stops-per-hour and cost-per-stop. The Bureau of Labor Statistics data on courier and messenger services tracks this segment as one of the more labor-intensive parts of logistics, meaning driver time is often the single biggest controllable cost.
For couriers, the key metrics are:
- Stops completed per driver per shift
- Miles driven per stop
- On-time delivery percentage
- Customer notification response (fewer “where’s my package” calls)
Zeo’s real-time GPS tracking and live ETA updates, paired with driver tracking software, directly address the last point — customers can watch their delivery approach via a branded tracking page, cutting down inbound support calls without any extra dispatcher effort.
Grocery and Pharmacy Delivery
Grocery and pharmacy delivery has tighter time windows and higher stakes for missed deliveries — a late prescription isn’t just an inconvenience. Time window constraints and priority stop settings (ASAP vs. Normal) let dispatchers make sure medically urgent or perishable orders get sequenced first, which also supports broader customer retention strategies for repeat delivery customers.
Proof of delivery matters more here too. Digital signature collection and photo capture create a paper trail for high-value or sensitive deliveries, which helps operations managers document what happened if a customer disputes a delivery.
Field Service Delivery Fleets
Field service businesses — pest control, HVAC, plumbing, landscaping — aren’t delivering packages, but they’re solving the same routing problem: getting the right person to the right location at the right time.
For these fleets, success looks like:
- More completed jobs per technician per day
- Reduced windshield time between appointments
- Faster response to emergency or same-day requests
Skill-based driver assignment matters more here than in pure delivery, since not every technician can handle every job type. Matching the right skill set to the right stop, automatically, removes a manual dispatching bottleneck that eats up a coordinator’s whole morning.
Calculate Your Own ROI: A Framework (Plus Interactive Calculator) Before You Buy
Before you commit budget, run your own numbers. Here’s the framework, plus what to plug into an ROI calculator.
Step 1: Calculate your current daily planning cost
Hours spent planning routes manually × dispatcher hourly rate × number of working days per month.
Example: 1.5 hours daily × $25/hour × 22 days = $825/month in planning labor alone.
Step 2: Estimate your mileage waste
Most manually-planned routes run 10-20% more miles than optimized routes. Take your monthly fuel spend and multiply by 0.15 as a conservative midpoint estimate. Tracking this accurately over time is easier with a miles tracking guide that logs mileage automatically for expense and tax records.
Example: $6,000 monthly fuel spend × 0.15 = $900/month in avoidable fuel cost.

increase fuel savings
Hassle Free Deliveries & Pickups!
Optimize routes with our algorithm, reducing travel time and costs efficiently.
Get Started for Free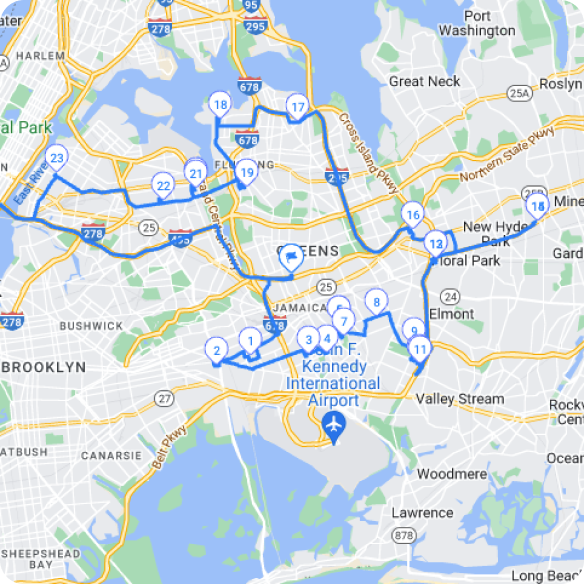
Step 3: Factor in overtime and missed-delivery costs
Add up monthly overtime pay tied to inefficient routing, plus any redelivery costs or refunds from missed time windows.
Step 4: Add it up against subscription cost
Compare your total monthly waste (planning labor + mileage + overtime + redeliveries) against the cost of route optimization software.
For a 20-driver fleet, it’s common to see combined monthly waste of $2,000-4,000 before optimization — often several times the cost of the software itself.
What to plug into your calculator:
- Number of active drivers
- Average stops per driver per day
- Current average planning time
- Monthly fuel spend
- Current on-time delivery rate
- Average dispatcher hourly rate
Run these numbers with your own fleet size before you evaluate any vendor. It turns a vague “will this be worth it” question into a concrete budget conversation you can bring to leadership.
From Signup to Results: A Realistic Week 1, Month 1, and Month 3 Rollout Timeline
Skeptical buyers deserve a transparent rollout plan, not a vague “you’ll see results eventually.”
Week 1: Setup and first optimized routes
Day 1, you import your stops. Zeo supports bulk address import via Excel, CSV, or Google Sheets, plus direct integrations with Shopify and WooCommerce if you’re running e-commerce delivery. You’ll add your drivers, assign vehicles, and set work hours and break times.
On Day 1, drivers simply download the Zeo mobile app to receive their optimized routes. They get turn-by-turn navigation, customer details, and the ability to capture proof of delivery — photo, signature, or notes — directly from their phone. They can also message dispatch in-app if something changes mid-route. This isn’t a “wait and see” rollout — drivers feel the difference in their day-to-day work from day one, not just managers watching a dashboard.
By end of Week 1, you should have your first full week of optimized routes running and your first baseline data on mileage and stop times.
Month 1: Refinement and adoption
Weeks 2-4 are about tuning. You’ll adjust time windows, priority settings, and driver skills as real-world exceptions surface. Most operations managers report full team adoption — dispatchers and drivers both comfortable with the new workflow — somewhere between week 2 and week 4.
By the end of Month 1, compare your baseline numbers from Week 1 against your Month 1 numbers: total mileage, planning time, on-time rate, and stops per driver.
Month 3: Measurable ROI
By Month 3, you should have enough data to make a confident before/after comparison. This is when most operations see the compounding gains: reduced overtime, fewer customer complaints, and route analytics reports that justify the software cost to leadership with real numbers, not projections.
This is also the point where recurring routes scheduling for regular customers can be set up on autopilot, further cutting weekly planning time.
Avoiding the Common Mistakes That Sink Route Optimization Rollouts
Even good software fails when the rollout is mishandled. Here are the mistakes to avoid.
Mistake 1: Not cleaning up your address data first
Bad or incomplete addresses lead to bad routes, no matter how good the optimization engine is. Audit your customer address list before your first import.
Mistake 2: Skipping driver buy-in
If drivers don’t trust the new routes, they’ll revert to their own habits. Involve a few experienced drivers early and let them test routes before full rollout — the app’s in-app chat makes it easy for them to flag issues to dispatch in real time.
Mistake 3: Ignoring time windows and constraints
If you don’t configure real time windows, capacity limits, and driver skills upfront, the optimization engine can’t account for your actual constraints. Garbage in, garbage out applies here.
Mistake 4: Expecting instant perfection
Realistic rollouts take 2-4 weeks to hit their stride. Expecting Day 1 perfection sets you up to abandon a tool that would have worked with a few more weeks of tuning.
Mistake 5: Not measuring a baseline
You can’t prove ROI to leadership if you don’t know your starting numbers. Capture your current mileage, planning time, and on-time rate before you switch — otherwise you have no “before” to compare against.
According to U.S. Department of Transportation research on last-mile logistics costs, inefficient last-mile logistics account for a disproportionate share of total delivery costs, often more than the long-haul portion of the same shipment. Getting the last mile right isn’t a nice-to-have. It’s the biggest lever you have.
The best delivery optimization success stories aren’t lucky. They’re the product of clean data, driver buy-in, a realistic timeline, and metrics tracked from Day 1. That’s a formula any fleet — 10 drivers or 75 — can replicate.
Frequently Asked Questions
Q: What metrics should I look for in a delivery optimization success story?
A credible success story should include a named company, a defined fleet size, a specific measurement period (30, 60, or 90 days), and before/after numbers on at least one of: mileage, planning time, on-time delivery rate, or stops per shift. If a case study is missing any of these, treat the results as unverifiable marketing rather than proof.
Q: How long does it typically take to see results after switching to route optimization software?
Most small fleets (1-15 drivers) see initial mileage and planning-time reductions within 1-2 weeks, while mid-size and large fleets typically need 4-8 weeks to reach full measurable ROI. Zeo Route Planner customers commonly report full team adoption between week 2 and week 4, with compounding gains in on-time rate and overtime reduction by month 3.
Q: What’s a realistic mileage reduction from switching to optimized routing?
Manually-planned routes typically run 10-20% more miles than optimized ones, based on aggregated fleet data. The exact gain depends on route density, stop count, and how tightly your current routes are already planned, so it’s best to calculate your own baseline before comparing to industry averages.
Q: Do small delivery businesses actually benefit from route optimization, or is it just for large fleets?
Small fleets (1-15 drivers) often see the fastest wins because there’s less operational complexity to untangle — some go from spreadsheet planning to optimized routes within a single week. Zeo Route Planner’s mobile app includes a free tier supporting up to 12 routes per month, making it accessible for small operations to test before committing to a paid plan.
Q: How do I calculate ROI before committing to route optimization software?
Add up your current planning labor cost (hours spent planning × dispatcher hourly rate), estimated mileage waste (typically 10-20% of fuel spend), and overtime or redelivery costs tied to inefficient routing. For a 20-driver fleet, this combined monthly waste commonly runs $2,000-4,000 — often several times higher than the cost of route optimization software itself.
—
Start a free Zeo Route Planner trial to run your own 30-day success story. No credit card required. Or book a live demo to see fleet-size-specific ROI projections built around your own operation.
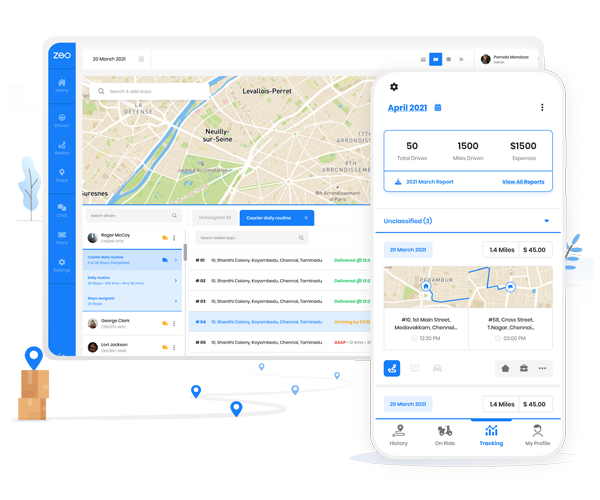
Are you a fleet owner?
Want to manage your drivers and deliveries easily?
Grow your business effortlessly with Zeo Routes Planner – optimize routes and manage multiple drivers with ease.
increase fuel savings
Hassle Free Deliveries & Pickups!
Optimize routes with our algorithm, reducing travel time and costs efficiently.
Get Started for Free