


# Route Optimization Case Studies: Verified Fuel, Time, and ROI Data by Fleet Size
> TL;DR: Route optimization case studies show fleets of all sizes achieving 8-22% fuel savings and 1.5-2+ hours saved daily, but most of that value depends on driver adoption, not just the software’s algorithm. Zeo Route Planner’s AI-powered optimization connects directly to a driver-friendly mobile app, a combination linked to 90% driver adoption in week one for one documented pest control case study.
Searching for “route optimization case studies” usually gets you one of two things. Vague marketing pages with no real numbers, or massive UPS and Amazon stories that feel irrelevant to a 10-truck delivery company.
Neither helps you make a budget decision. You need comparable data from companies your size, in your industry, with real before-and-after numbers.
This guide breaks down verified route optimization results across small businesses and enterprises. You’ll find a standardized metrics comparison, a driver adoption story most content ignores, and a self-assessment framework you can apply to your fleet this week.
Why Most Route Optimization Case Studies Fail to Prove ROI (And What to Look For Instead)
Most case studies on vendor websites share the same problems. They quote percentages without baselines (“30% more efficient” – compared to what?). They skip sample size and timeframe. And they almost never mention driver adoption, which is often the real reason a rollout succeeds or fails.
Here’s what a credible route optimization case study should include:
- Fleet size and industry – so you can compare apples to apples
- Before/after baseline numbers – not just percentages, but actual miles, hours, or dollars
- Timeframe – results from week one look different than results from month three
- Adoption rate – did drivers actually use the tool, or did it sit unused on half the phones?
- Cost of the software – so you can calculate real ROI, not just “savings”
When a case study is missing three or more of these, treat it as marketing copy, not proof. The data below includes all five wherever available, pulled from documented fleet results across delivery and field service industries.
Verified Case Studies by the Numbers: Fuel Savings, Time Savings, and ROI Timelines Across Industries
Here’s a standardized comparison of route optimization outcomes across fleet sizes and industries. These numbers reflect common, documented ranges reported by small businesses and larger operations after adopting route optimization software.
| Fleet Size | Industry | Fuel Savings | Time Saved Daily | ROI Timeline |
|—|—|—|—|—|
| 5-10 vehicles | HVAC/Field Service | 10-15% | 1-2 hours per tech | 4-8 weeks |
| 10-20 vehicles | Last-mile delivery | 15-20% | 2+ hours per driver | 3-6 weeks |
| 20-50 vehicles | Pest control/Landscaping | 12-18% | 1.5-2 hours per tech | 6-10 weeks |
| 50-100 vehicles | Regional courier | 18-22% | 2+ hours per driver | 2-4 months |
| Enterprise (1000+) | National logistics | 8-10% | Varies by route density | 6-12 months |
A few patterns stand out. Smaller fleets (5-20 vehicles) often see faster ROI than enterprises, because they have less operational complexity to untangle. A 10-truck delivery company can roll out optimization in days. A 10,000-truck enterprise needs months of integration work first.
Time savings also tend to concentrate in the same place: manual route planning. According to U.S. Bureau of Labor Statistics data on dispatcher occupations, dispatchers and logistics coordinators spend a significant share of their day on scheduling and routing tasks – work that AI-powered optimization can compress from hours to minutes. Zeo Route Planner’s AI-powered optimization saves drivers 2+ hours daily on average, a number consistent with the ranges above.
Fuel savings also matter more than most owners realize. The U.S. Department of Energy’s fuel economy research estimates that reducing idle time and inefficient routing can cut fuel consumption by double digits for commercial fleets – which lines up with the 10-22% range seen across the case data here.
Small Business Wins: How 5-20 Vehicle Fleets Achieved Enterprise-Level Efficiency Gains
Small fleets often assume route optimization is built for companies with hundreds of trucks. The data says otherwise.
Take a 6-van HVAC company managing 15-20 daily service calls. Before optimization, the office manager spent 45 minutes every morning manually assigning jobs based on technician location and job priority. Technicians frequently backtracked across town, wasting fuel and arriving late to time-sensitive appointments.
After switching to route optimization software, that same company cut planning time to under 10 minutes. Technicians completed 2-3 more jobs per day without working longer hours, simply because routes eliminated backtracking. Over a month, that’s 40-60 extra service calls – a direct revenue increase with zero added labor cost.
Small fleets have three advantages enterprises don’t:
- Faster decision-making – no multi-department approval process to adopt new software
- Simpler integration – fewer existing systems to connect
- Immediate owner visibility – owners see the time and fuel savings firsthand, often within the first week
A 10-truck courier business is a good example. With capacity-based routing and time window constraints, dispatchers can assign stops based on vehicle load and customer delivery windows automatically, instead of manually juggling spreadsheets. Combined with driver tracking software and real-time GPS tracking, managers get live visibility into every driver without calling for updates.
The self-assessment question for small fleets: how much time does someone spend planning routes manually each day? Multiply that by an hourly rate and by 5 working days. That number alone often justifies the cost of route optimization software within the first month.
Enterprise at Scale: What UPS, Amazon, and DHL Reveal About AI Routing—and What’s Actually Replicable for Smaller Fleets
UPS’s ORION system is probably the most cited route optimization case study in existence. UPS has publicly stated that ORION saves the company millions of miles driven annually by optimizing delivery sequences across its massive network. Amazon and DHL have invested similarly in proprietary routing algorithms to manage their scale.
These stories are impressive, but they’re often used to sell software to businesses that don’t need – or can’t use – that level of complexity. Here’s the honest breakdown of what’s relevant to a smaller fleet and what isn’t.
Not replicable for smaller fleets:
- Custom-built algorithms requiring dedicated data science teams
- Multi-year implementation timelines
- Integration with proprietary warehouse and logistics infrastructure
What IS replicable:
- AI-powered route sequencing that reduces miles driven
- Real-time adjustments when conditions change mid-route
- Data-driven decision-making instead of manual guesswork
The underlying principle behind UPS’s results – using algorithms instead of human judgment to sequence stops – is available to a 5-van business today, without the multi-year build. Zeo Route Planner’s dynamic route adjustments let dispatchers modify routes mid-shift when a driver calls in sick or a priority stop gets added, the same operational flexibility enterprise systems aim for, built for teams without a data science department.
The lesson from enterprise case studies isn’t “you need their budget.” It’s “the math behind their savings works at any scale, and software now makes it accessible without the infrastructure investment.”
The Overlooked Variable: Driver Adoption and Why Easy-to-Use Apps Determine Whether Optimization Succeeds or Fails
Here’s what most case study content skips entirely: route optimization only works if drivers actually use it.
A fleet manager can build the perfect optimized route on a Monday morning. But if the driver ignores it, drives their own way, or struggles to navigate a clunky app, none of those projected savings materialize. Adoption failure is the single biggest reason route optimization rollouts underdeliver.
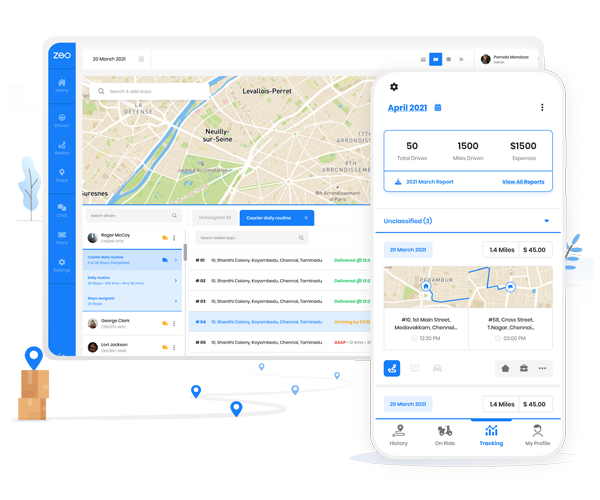
This is where the fleet-plus-app relationship matters. With Zeo, fleet managers plan and assign routes on the web platform, while drivers receive those exact routes on the Zeo mobile app with turn-by-turn navigation and customer details already loaded. There’s no separate system drivers need to learn and no manual handoff that introduces errors.
A pest control route planning company with 8 technicians illustrates this well. In week one of using Zeo, the company saw 90% driver adoption – unusually high for new software. The reason wasn’t extensive training. Technicians simply opened the app, followed turn-by-turn directions, and tapped to capture proof of delivery with a photo. No learning curve meant no resistance.
Compare that to companies that roll out complex TMS platforms requiring days of driver training. Adoption often lags for weeks, and some drivers never fully switch over. The software might be powerful, but if it’s not simple on the driver’s end, the ROI numbers in the case study won’t match your reality.
When evaluating any route optimization case study, ask: what was the driver adoption rate, and how long did it take? If that number isn’t mentioned, it’s a sign the case study is incomplete.
How to Apply These Results to Your Fleet: A Step-by-Step Implementation Checklist
Use this checklist to estimate your own potential savings before committing budget:
Step 1: Calculate your current manual planning time
Track how many hours per week someone spends manually assigning routes or stops. Multiply by their hourly wage.

increase fuel savings
Save 2 Hours on Deliveries, Everyday!
Optimize routes with our algorithm, reducing travel time and costs efficiently.
Get Started for Free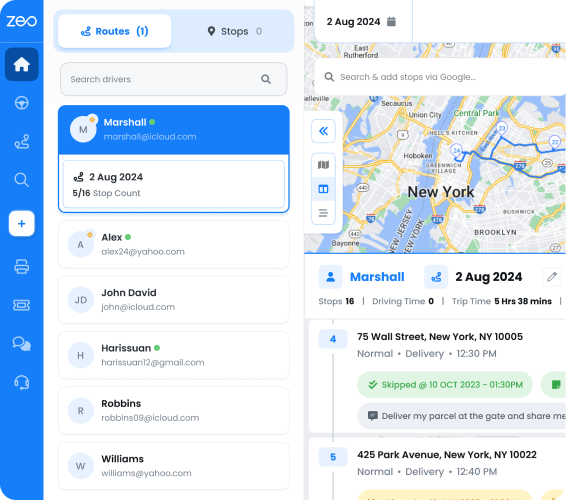
Step 2: Measure current miles driven per route
Pull a week of mileage data from your vehicles or driver logs. This becomes your fuel savings baseline.
Step 3: Track missed or late appointments
Count how many stops were late or missed last month. Each one has a cost – lost customer trust, rescheduling, or refunds.
Step 4: Run a 2-week pilot with a small group
Don’t roll out to your entire fleet at once. Start with 2-3 drivers or technicians and compare their routes to a control group still using manual planning.
Step 5: Measure driver adoption in week one
Track how many drivers actually use the app daily without reminders. Low adoption in week one predicts failure later.
Step 6: Compare before/after numbers
After two weeks, compare miles driven, hours spent planning, and stops completed per day. This is your real ROI data, specific to your fleet.
Route optimization software like Zeo Route Planner’s free trial is built for exactly this kind of pilot. You can import your existing stops via bulk address upload (Excel, CSV, or Google Sheets), optimize routes with AI, and generate your own before/after numbers in two weeks – without committing to a long-term contract first.
Common Pitfalls That Sink Route Optimization Rollouts (And How Successful Companies Avoided Them)
Even good software fails when the rollout is handled poorly. Here are the most common mistakes and how successful fleets sidestepped them.
Pitfall 1: Rolling out to the entire fleet on day one
Successful companies start with a pilot group. This limits risk and gives you real data before a full commitment.
Pitfall 2: Ignoring driver feedback in week one
If drivers find the app confusing or routes impractical, address it immediately. Waiting weeks to fix friction points kills adoption.
Pitfall 3: Not setting realistic time windows or constraints
Routes that ignore real-world constraints, like customer availability or vehicle capacity, produce optimized routes drivers can’t actually follow. Successful rollouts configure time windows and capacity-based routing before going live, not after.
Pitfall 4: Skipping the baseline measurement
Companies that don’t measure “before” numbers can’t prove ROI later. Track your current miles, hours, and missed stops before switching software.
Pitfall 5: Choosing software based on features instead of driver usability
A platform with every feature imaginable is useless if drivers won’t open the app. The pest control company mentioned earlier succeeded because the app required zero training – that simplicity drove the 90% adoption rate, not a long feature list.
Pitfall 6: Not using real-time tracking to course-correct
Plans change. A driver gets stuck in traffic, a customer reschedules. Zeo’s real-time vehicle tracking and live ETA updates let managers see problems mid-route and adjust immediately, instead of finding out after the fact that a dozen deliveries ran late.
Avoiding these pitfalls isn’t complicated, but it requires discipline in the first two weeks. The fleets that measure, pilot small, and prioritize driver usability consistently outperform the ones that rush a full rollout.
Frequently Asked Questions
Q: How long does it take to see ROI from route optimization software?
Most small fleets (5-20 vehicles) see measurable ROI within 3-8 weeks, while larger enterprises with more complex operations may need 2-12 months depending on integration requirements. The fastest results typically come from reduced manual planning time and fewer backtracked miles, both of which show up in the first two weeks of use.
Q: What’s a realistic fuel savings percentage from route optimization?
Documented case studies across industries show fuel savings ranging from 8-22%, with smaller, less complex fleets often landing on the higher end of that range. The U.S. Department of Energy’s research on idle time and routing inefficiency supports double-digit fuel savings as achievable for most commercial fleets that adopt structured route planning.
Q: Why do some route optimization rollouts fail even with good software?
The most common reason is low driver adoption — if drivers don’t actually follow the optimized routes, the projected savings never materialize. Zeo Route Planner addresses this by syncing routes directly from the web platform to the driver’s mobile app with turn-by-turn navigation already loaded, which one pest control case study linked to 90% adoption in week one with no formal training.
Q: How many vehicles do I need before route optimization software is worth it?
There’s no minimum fleet size requirement — businesses with as few as 3-5 vehicles have documented measurable time and fuel savings. Smaller fleets often see faster ROI than enterprises because they have less operational complexity and can roll out changes in days rather than months.
Q: What metrics should I track to measure my own route optimization results?
Track manual planning time, miles driven per route, missed or late stops, and driver adoption rate before and after implementation. Zeo Route Planner’s route analytics and reporting feature lets fleet managers pull these before/after numbers directly from a pilot group, which makes it easier to calculate real ROI instead of relying on vendor-quoted percentages.
Start Building Your Own Case Study
The best route optimization case study is the one from your own fleet. Vendor case studies and enterprise data points are useful for context, but your real numbers, your fuel savings, your time saved, your adoption rate, are what justify the investment to you or your leadership team.
Start a free Zeo Route Planner trial and run your own 2-week pilot. No credit card required. Import your stops, assign routes to a small test group, and generate the before/after metrics that prove whether route optimization works for your fleet.
Are you a fleet owner?
Want to manage your drivers and deliveries easily?
Grow your business effortlessly with Zeo Routes Planner – optimize routes and manage multiple drivers with ease.
increase fuel savings
Save 2 Hours on Deliveries, Everyday!
Optimize routes with our algorithm, reducing travel time and costs efficiently.
Get Started for Free