



# Route Optimization Case Studies by Fleet Size: Real Numbers, Real Methodology
> TL;DR: Route optimization case studies work best when matched to your fleet size, since a 6-vehicle operation faces different constraints than a 10,000-vehicle enterprise fleet. Small and mid-size fleets typically see planning time drop from hours to minutes and a 10-20% reduction in miles driven, with Zeo Route Planner’s dynamic route adjustments mid-shift helping field service teams insert priority jobs without rebuilding the day’s schedule. The most reliable number isn’t a published case study — it’s a 30-day in-house comparison using your own baseline data.
Search “route optimization case studies” and you’ll get the same five names: UPS, Amazon, DHL, FedEx, Walmart. Impressive numbers, sure. But you run 8 trucks, not 8,000.
This guide is different. We’re breaking down route optimization case studies by fleet size, showing transparent methodology behind every number, and giving you a framework to estimate your own savings before you spend a dollar.
Why Most Route Optimization Case Studies Don’t Apply to Your Fleet (The Enterprise Bias Problem)
Most published route optimization case studies come from one of two sources: the big logistics giants, or the software vendors who serve them. That creates a problem for everyone else.
Here’s the enterprise bias in action. UPS famously saved millions by eliminating left turns from delivery routes, cutting fuel use and idle time across a fleet of 100,000+ vehicles. It’s a real, well-documented result. But a left-turn elimination strategy built for a fleet that size doesn’t map onto a 12-van pest control company working four zip codes. If you’re unfamiliar with the basics of how routing algorithms actually sequence stops, this overview of what route optimization is is a useful primer before diving into case study comparisons.
Enterprise fleets have different constraints than yours:
- Scale smooths out variance. One bad route in a 10,000-vehicle fleet is a rounding error. One bad route in a 6-vehicle fleet is 16% of your operation.
- Enterprise routes are often pre-zoned. Big carriers already have fixed delivery zones and depot networks. Small and mid-size fleets usually start with no zoning at all, which means more room for improvement.
- Driver turnover and training differ. A 50,000-person workforce absorbs software rollout friction differently than a 15-driver team where one skeptical technician can tank adoption.
- The underlying math doesn’t scale down cleanly. A 20% fuel savings claim means something very different applied to 200,000 gallons versus 2,000 gallons.
None of this means route optimization doesn’t work for small and mid-size operations. It means you need case studies built around fleets that actually look like yours, with the methodology shown, not hidden. That’s what the next sections cover.
Verified Case Study Breakdown by Fleet Size: Small (1-10), Mid-Size (10-50), and Enterprise Operations
Route optimization delivers different kinds of ROI depending on fleet size, because the starting point is different. Here’s how the three segments typically compare.
Small fleets (1-10 vehicles)
Most small fleets in delivery or field service still plan routes manually — a dispatcher using memory, a paper map, or a spreadsheet. The biggest gain here isn’t incremental efficiency. It’s eliminating guesswork entirely.
Typical starting point: 1-2 hours per day spent manually sequencing stops, often by someone who should be doing other work. Typical result after optimization: that planning time drops dramatically, since AI-powered route optimization software can sequence stops in minutes instead of hours.
Mid-size fleets (10-50 vehicles)
This is where route optimization case studies get interesting, because the complexity jumps non-linearly. A 10-vehicle fleet has roughly 3.6 million possible route combinations for just 10 stops each. Manual dispatch at this scale isn’t just slow — it’s mathematically incapable of finding the best routes.
Mid-size operations typically see gains in three areas: fewer total miles driven, more completed stops per driver per day, and better on-time performance from live ETA updates. Capacity-based routing also starts to matter more here, since mid-size fleets often run mixed vehicle types with different load limits.
Enterprise operations (50+ vehicles, for context)
Enterprise case studies — like the widely cited UPS left-turn example — tend to emphasize aggregate fuel and emissions savings across massive volume. According to the U.S. Department of Energy’s fuel economy research, optimized routing and reduced idling can meaningfully cut fuel consumption for commercial fleets, though exact figures vary by vehicle type and route density. These numbers are real, but they’re reported at a scale where a 1% improvement equals a seven-figure result. Useful for context, not for budgeting your own ROI.
Real Results: Small & Mid-Size Fleet Spotlight Across Delivery, Field Service, and Waste Management
Numbers mean more with context. Here’s how route optimization plays out across three common small-to-mid fleet types.
Delivery: regional courier, 7 drivers
A regional courier running same-day deliveries across one metro area was manually assigning stops each morning, a process that took their dispatcher close to 90 minutes daily. Drivers often backtracked across the same neighborhoods multiple times because stops were assigned by account, not by geography.
After switching to automated route optimization, dispatch planning dropped to under 15 minutes. Drivers reported fewer missed delivery windows, aided by live ETA updates that let customers know when to expect their package instead of guessing.
Field service: HVAC company, 14 technicians
An HVAC company with 14 technicians across two trucks’ worth of service calls per tech, per day, struggled with a common field service problem: emergency calls disrupting the planned schedule. Dispatchers were manually re-sequencing jobs by phone, which meant delays stacked up across the whole day.
With dynamic route adjustments mid-shift, dispatchers could insert priority (ASAP) jobs into a technician’s existing route without manually rebuilding the whole schedule. One dispatcher described the shift simply: the software told her which tech was actually closest, instead of her guessing based on who called in last.
Waste management: commercial collection route, 22 vehicles
A commercial waste collection operation running 22 trucks across industrial and retail accounts had a capacity problem: trucks were sometimes dispatched to routes that exceeded their load capacity, forcing mid-route trips back to the depot. Capacity-based routing, which factors in vehicle weight and volume limits before assigning stops, eliminated most of these mid-route returns.
Drivers also used photo capture as proof of delivery at commercial accounts, which cut down on billing disputes over missed or incomplete pickups.
Across all three examples, the common thread isn’t a dramatic single number — it’s the removal of manual bottlenecks that scale badly as fleets grow past “a dispatcher can remember it all.”
How We Measure ROI: Methodology, Timeframes, and What “Fuel Savings” Actually Means
Case studies fall apart when the methodology is vague. Before you trust any route optimization statistic — ours or a competitor’s — ask these four questions.
What’s the baseline? A fair comparison measures your current routes (miles, time, fuel, stops completed) over a set period, typically 2-4 weeks, before any software changes. Without a documented baseline, “we saved 20%” is a guess, not a measurement.
What’s actually being measured? “Fuel savings” can mean reduced total miles driven, reduced idle time, fewer trips back to depot, or some combination. Each driver has a different cost structure. A claim should specify which one it’s measuring. The American Transportation Research Institute’s operational cost benchmarking data is a useful external reference for understanding how fuel, time, and vehicle costs are typically broken down in fleet operations.
What’s the timeframe? Short-term results (week 1-2) often look worse than steady-state results, because drivers are still adjusting to new routes. Most reliable case studies report results after a 30-day adoption period, not day one.
Is the comparison apples-to-apples? Route volume, stop density, and seasonal demand all affect miles and time. A valid comparison holds these roughly constant, or explicitly adjusts for the difference.
This is exactly why we recommend a 30-day in-house comparison rather than relying purely on third-party numbers. You control the baseline, the timeframe, and the variables — which means the result is trustworthy because it’s yours.
The Hidden Variable Behind Every Successful (and Failed) Rollout: Driver Adoption
Here’s what most route optimization case studies leave out entirely: the software’s potential ROI and the fleet’s actual ROI are two different numbers. The gap between them is driver adoption.
A fleet can run the best routing algorithm available and still see zero improvement if drivers ignore the assigned route and default to habit. This is the single biggest factor separating fleets that report 20-30% fuel savings from fleets that quietly revert to old routines within a few weeks. Our driver retention guide covers related strategies for keeping technicians engaged with new tools during a software transition.

increase fuel savings
Save 2 Hours on Deliveries, Everyday!
Optimize routes with our algorithm, reducing travel time and costs efficiently.
Get Started for Free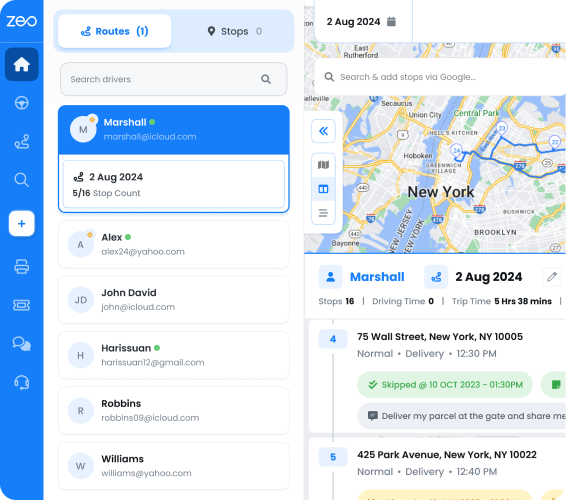
Adoption comes down to friction. If receiving a route requires logging into a separate system, decoding unfamiliar instructions, or dealing with a clunky interface, drivers will route around it — literally. This is why the tool drivers actually use in the field matters as much as the optimization engine behind it.
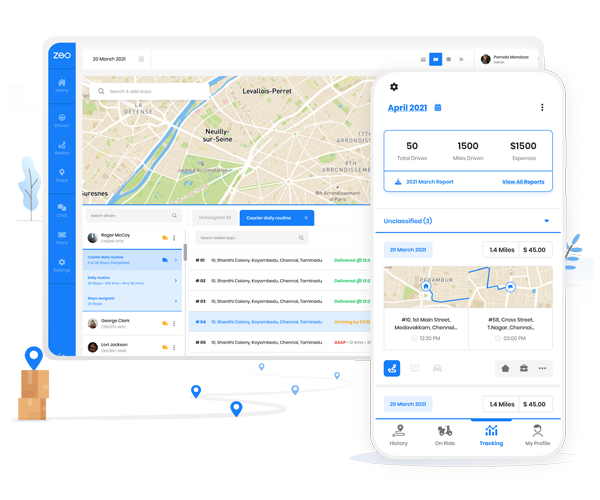
With Zeo, fleet managers plan and assign routes through the web platform, and drivers receive those routes directly on their phones through the Zeo mobile app — complete with turn-by-turn navigation, customer details, and delivery or service notes already attached. The app is also used independently by solo drivers and owner-operators, which means it’s been built and refined around real-world ease of use, not just dashboard functionality for managers. That low-friction handoff — manager assigns, driver opens app and drives — is what determines whether a case study’s numbers ever show up in your own fleet.
Practical adoption checklist:
- Train drivers on the mobile app before full rollout, not after
- Start with your most tech-comfortable drivers as early adopters
- Use in-app chat to resolve route confusion in real time instead of phone calls
- Review driver performance analytics weekly during the first month to catch disengagement early
Common Failure Modes: What Goes Wrong When Route Optimization Doesn’t Deliver ROI
Not every rollout succeeds. Being upfront about why some fail is part of building trust — and it helps you avoid the same mistakes.
Failure mode 1: No baseline measurement. Fleets that skip measuring their “before” state can’t prove ROI afterward, even if real improvement happened. Without a baseline, you’re negotiating your next software renewal based on a feeling, not data.
Failure mode 2: Poor or inconsistent address data. Route optimization is only as good as the stop data feeding it. Fleets importing addresses from messy spreadsheets with incomplete or incorrect entries see degraded routing quality. Bulk address import tools that support Excel, CSV, and Google Sheets help, but someone still needs to clean the data first.
Failure mode 3: Ignoring driver feedback loops. When drivers hit real-world issues — a gate that’s locked during assigned time windows, a loading zone that doesn’t match the pin location — and there’s no fast way to flag it, they lose trust in the system and stop following it.
Failure mode 4: Treating optimization as “set and forget.” Routes need adjustment as your business changes: new customers, seasonal demand shifts, new service areas. Fleets that optimize once and never revisit their settings see returns decay over time.
Failure mode 5: No executive or dispatcher buy-in. If the person building the schedule doesn’t trust the optimization engine, they’ll manually override it constantly, which defeats the purpose and confuses drivers about which version of the route is final.
The U.S. Bureau of Labor Statistics reports that transportation and delivery occupations are among the fastest-growing segments through the decade, which means fleets that fix these failure modes now are better positioned to scale without proportionally scaling dispatch overhead.
Calculate Your Own Potential Savings: A Practical ROI Framework
Instead of borrowing someone else’s case study number, run this quick estimate using your own fleet’s data.
Step 1: Calculate your current cost per route.
Take your average daily miles per vehicle × your fuel cost per mile × number of vehicles. Add in estimated dispatcher planning time, valued at their hourly rate.
Step 2: Identify your inefficiency indicators.
Ask: How often do drivers backtrack? How many stops get missed or rescheduled weekly? How much time does a dispatcher spend manually assigning routes each day?
Step 3: Apply a conservative improvement range.
Based on documented small and mid-size fleet examples, a reasonable conservative estimate is 10-20% reduction in miles driven and significant reduction in planning time (often from hours to minutes), rather than assuming maximum published figures apply to you.
Step 4: Run the real test.
The most reliable number isn’t a formula — it’s your own 30-day comparison. Track your current routes, fuel costs, and completed stops for two to four weeks. Then run the same period with route optimization active and compare directly.
This is the exact approach we recommend to every fleet evaluating Zeo: don’t take our word for the ROI, measure it in your own operation using built-in analytics and reporting.
Frequently Asked Questions
Q: How long does it take to see ROI from route optimization software?
Most small and mid-size fleets see planning-time savings within the first week, since dispatchers immediately spend less time manually sequencing stops. Mileage and fuel savings typically require a full 30-day measurement cycle to account for route variability and driver adjustment periods.
Q: What’s a realistic fuel savings percentage for a small fleet, not an enterprise one?
Documented small and mid-size fleet examples typically show a conservative 10-20% reduction in miles driven, which is a more realistic benchmark than enterprise-scale headlines. The actual number depends heavily on how inefficient your current manual routing is to begin with — fleets starting from pure manual dispatch tend to see larger initial gains than those already using basic zoning.
Q: Do I need GPS tracking hardware to measure route optimization results?
No — you don’t need a dedicated telematics system to get started. Many small fleets track baseline fuel costs through fuel card statements or mileage logs, and tools like Zeo’s miles tracking feature support basic expense and tax record-keeping as a simpler starting point than a full telematics rollout.
Q: Why do some route optimization rollouts fail to deliver expected savings?
The most common failure points are skipping baseline measurement, feeding the system messy address data, and low driver adoption of the new routes. Software can only generate ROI if drivers actually follow the optimized route — Zeo addresses the adoption gap by giving drivers turn-by-turn navigation, stop details, and service notes directly in the same mobile app they use to receive routes, reducing the friction that causes drivers to revert to habit.
Q: How many stops or vehicles justify switching from manual dispatch to route optimization software?
Even single-driver operations benefit once they’re sequencing 10 or more daily stops manually, since that process becomes time-consuming regardless of fleet size. The ROI becomes more pronounced once you’re coordinating 3-5 or more vehicles, where manual dispatch can no longer realistically find the most efficient combination of stops.
—
You don’t need a UPS-sized fleet to prove route optimization works — you need your own numbers. Start a free Zeo trial and run your own 30-day case study: compare your current route times, fuel costs, and completed stops before and after optimization, with built-in analytics to track exactly what changes.
Are you a fleet owner?
Want to manage your drivers and deliveries easily?
Grow your business effortlessly with Zeo Routes Planner – optimize routes and manage multiple drivers with ease.

increase fuel savings
Save $200 on fuel, Monthly!
Optimize routes with our algorithm, reducing travel time and costs efficiently.
Get Started for Free