
Fleet Dashboard | Zeo Route Planner ...
Fleet Platform

See Your Entire Fleet
in Real Time

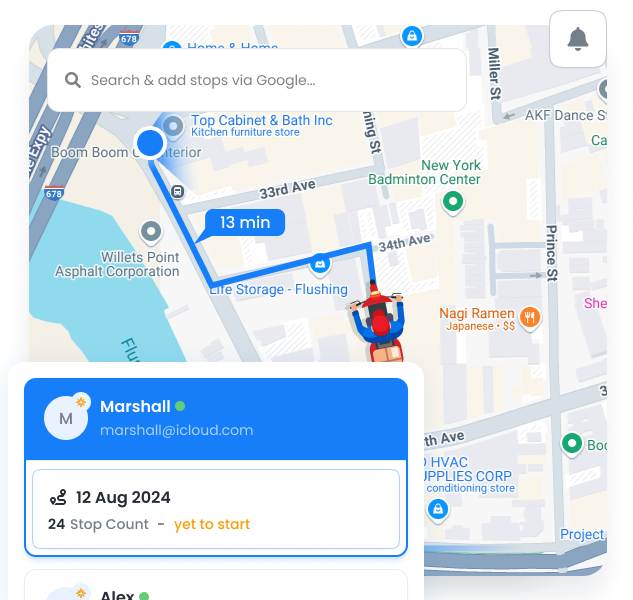
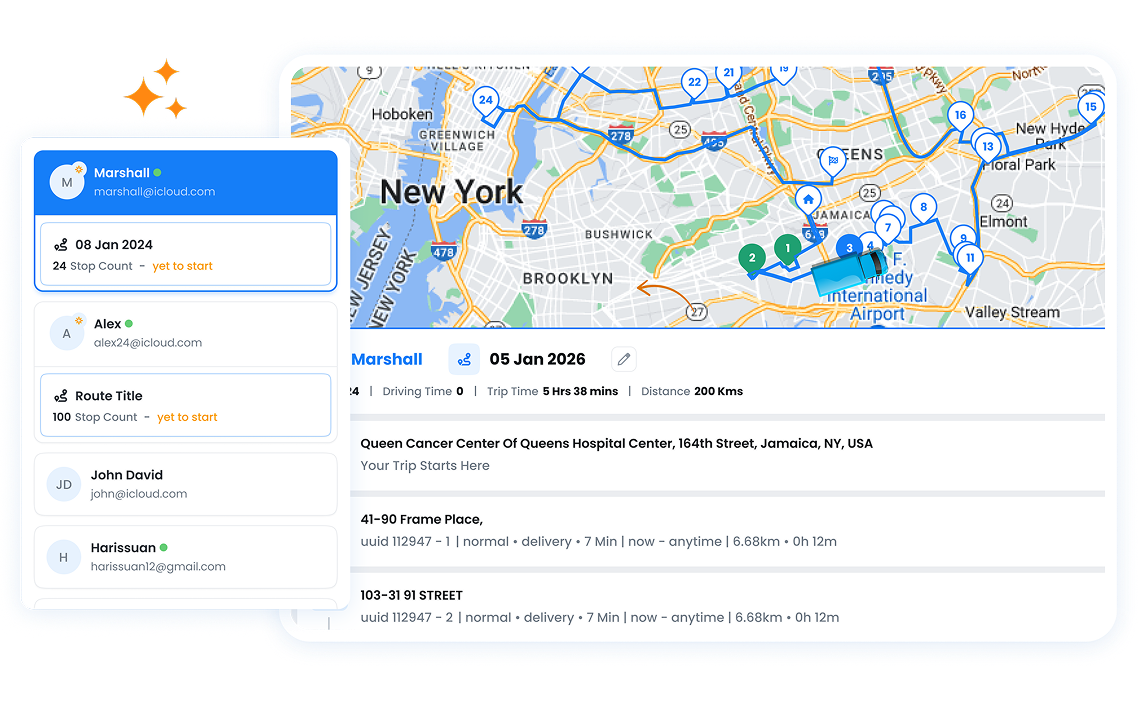
One dashboard showing every team member’s location, route progress, and ETA. No more guessing
where people are or calling to check status — it’s all right here, updating every 30 seconds.
Zeo Route Planner
  • 30s

    Location refresh rate

  • 100%

    Fleet visibility

  • 95%

    ETA accuracy

Dashboard Capabilities

Everything you need to monitor your fleet from one screen.

Frame 1707478314 5, Zeo Route Planner

Real-Time Location

See exactly where each team member is, updated every 30 seconds. GPS-accurate positioning on an interactive map.

Frame 1707478314 6, Zeo Route Planner

Progress Monitoring

Track completed vs. remaining stops for each route. Visual progress bars show how far along each person is.


Group 11880 10, Zeo Route Planner

ETA Tracking

Live ETAs for each stop, automatically recalculated based on current location and traffic conditions.

Frame 1707478314 7, Zeo Route Planner

Status Indicators

Color-coded status: on schedule (green), slight delay (yellow), behind schedule (red). Spot issues at a glance.

Group 11880 11, Zeo Route Planner

Battery Monitoring

See device battery levels for each team member. Get alerts when batteries are low to prevent tracking interruptions.

Frame 1707478314 8, Zeo Route Planner

Fleet Overview

Summary panel showing total stops, completed, remaining, and aggregate statistics for the entire fleet.

Frame 1707478314 8, Zeo Route Planner

Multi-Route Overview

Analyse all routes and servicemen from one screen with real-time tracking and insights.

What You See on the Dashboard

A single view designed for dispatchers and operations managers.


Interactive Map

Zoom, pan, and click on any driver to see their details and route


Driver List Panel

Sortable list of all active drivers with quick stats and status


Alerts & Notifications

Real-time alerts for delays, completed routes, and issues


Multi-Route Visualization

Instantly see all routes for a selected date on one map.

Dashboard Preview

How Businesses Use the Dashboard

Real-time visibility transforms daily operations.

DELIVERY

Customer Service Response

When a customer calls asking “where’s my delivery?”, the support team opens the dashboard and answers in seconds: “Your driver is 3 stops away, ETA 2:15 PM.” No callbacks needed.

FIELD SERVICE

Emergency Dispatch

An urgent service call comes in. The dispatcher checks the dashboard, sees which technician is closest and has capacity, and assigns the stop — all within 2 minutes.

DELIVERY

End-of-Day Monitoring

Operations manager monitors the dashboard at 4 PM to identify drivers who might need help finishing their routes. Reassigns stops to ensure all deliveries complete on time.

FIELD SERVICE

Client Reporting

A property management company shows clients the live dashboard during meetings, demonstrating how their properties are being serviced in real-time. Builds trust and transparency.

Get Real-Time Fleet Visibility

See where your team is, right now with 7-day free trial.


Zeo Questionnaire

Frequently
Asked
Questions

Know More

Fleet Dashboard

What is the Fleet Dashboard in Zeo?

Zeo’s Fleet Dashboard provides a real-time view of all active vehicles, agents, and route progress in one centralized screen.

Can I see agent locations live?

Yes. The Fleet Dashboard shows live GPS locations and movement of each agent on the map.

Does the dashboard show stop status at a glance?

Absolutely. You can see completed, in-progress, and delayed stops in real time.

How many drivers can be tracked at once?

There's no limit. The dashboard is designed to handle fleets of any size. For very large fleets (100+ drivers), you can filter by team, zone, or status to focus on specific groups.

Does the Fleet Dashboard update automatically?

Yes. Live data streams keep the dashboard up to date without manual refreshes.

Zeo Blogs

Explore our blog for insightful articles, expert advice, and inspiring content that keeps you informed.

Delivery Optimization Success Stories: Real Fleet Results

Real delivery optimization success stories with verified KPIs by fleet size and industry, plus an ROI calculator to estimate your own savings.

Route Optimization Case Studies: Real SMB Results (2026)

Real route optimization case studies from small delivery and field service businesses—actual costs, timelines, and ROI. See what

How to Plan Propane Delivery Routes During Peak Season

Learn how to plan propane delivery routes during peak season with a week-by-week playbook, KPI checklist, and route optimization tips for winter demand.

Xlork is a developer-first data import platform. It lets you embed CSV, Excel, and Google Sheets import into any app with AI-powered column mapping and schema validation. Explore free developer tools like JSON-to-CSV converters and color palette generators. No more building import flows from scratch — just drop in the Xlork SDK, sign up free, and ship clean data in minutes.