


# The Delivery Optimization Success Story Checklist: How to Spot Real Proof vs. Marketing Fluff
> TL;DR: A legitimate delivery optimization success story includes specific percentages, a disclosed timeframe, a before-and-after baseline, and honest acknowledgment of rollout friction — not vague claims like “save up to 50%.” Most software ROI takes 60-90 days to stabilize as teams adjust workflows, and tools like Zeo Route Planner’s AI-powered route optimization help fleets redirect that reclaimed planning time into more stops per shift, with users reporting 2+ hours saved daily once adoption is consistent.
Search “delivery optimization success story” and you’ll find the same vague claims repeated everywhere. “Save time and money.” “Boost efficiency by 30%.” No company names. No fleet sizes. No timeframes you can actually check.
That’s a problem if you’re an operations manager trying to justify a software switch to your CFO. You need numbers you can verify, not marketing copy you have to take on faith.
This guide is different. We’ll show you a framework to spot real proof versus fluff, walk through verified case data segmented by industry and fleet size, give you a way to calculate your own ROI, and tell you the honest “what went wrong first” stories most vendors won’t share. By the end, you’ll have a checklist to evaluate any delivery optimization success story — including ones about Zeo.
What Actually Counts as a Legitimate Success Story
Most vendor case studies fail a basic credibility test. Here’s what separates real proof from marketing fluff.
Specific numbers, not ranges. “Reduced drive time by 23%” is credible. “Save up to 50%” is not. Real results have exact percentages, tied to a specific time period. If you want to see this standard applied across multiple fleet sizes, these route optimization case studies break down real numbers by industry.
Named company or verifiable fleet profile. You don’t always need a company name (some businesses prefer anonymity), but you need enough detail to assess relevance: fleet size, industry, stop volume, and region.
Before-and-after baseline. A legitimate story tells you what the company was doing before — spreadsheets, Google Maps, a legacy TMS — and what changed after. Without a baseline, “improvement” numbers are meaningless.
Timeframe disclosed. Did results show up in week one or month six? According to McKinsey’s research on digital transformation ROI timelines, most software ROI takes 60-90 days to stabilize as teams adjust workflows. Any story claiming instant, permanent results deserves scrutiny.
Failure points acknowledged. Real rollouts have friction — driver resistance, messy address data, integration bugs. If a case study reads like a flawless success from day one, it’s probably been sanitized.
Use this five-point checklist on every vendor claim you read, including the ones below.
Verified Delivery Optimization Success Stories by Industry and Fleet Size
Here’s how a delivery optimization success story plays out across different industries and fleet sizes. These are illustrative profiles based on common patterns we see across Zeo’s 1.5M+ users in 150+ countries — use them to benchmark your own situation, not as guaranteed outcomes.
Courier and Last-Mile (10-25 vehicles)
A regional courier running 15 vans was manually building routes each morning in Google Maps, taking a dispatcher nearly 90 minutes daily. Stops were sequenced by guesswork, and drivers frequently backtracked across the same zip codes.
After switching to AI-powered route optimization, route planning dropped to under 15 minutes. Drivers covered more stops per shift because routes were sequenced by proximity and time windows instead of manual estimation. This matches a broader pattern: the U.S. Department of Transportation notes that inefficient routing is a leading contributor to excess fuel consumption in last-mile delivery fleets.
Field Service: Pest Control (20-40 technicians)
A pest control company managing 30 technicians across three service areas struggled with skill mismatches — sending a general technician to a job that needed a licensed specialist. Dispatchers assigned jobs by memory, which caused delays and callbacks.
Skill-based assignment matched technicians to jobs automatically based on certification and location. Combined with time window scheduling, the company reduced missed appointment windows and cut technician idle time between jobs. Capacity-based routing also ensured trucks carrying chemical inventory stayed within safe load limits. Companies running similar operations often use dedicated pest control route planning workflows to manage recurring treatment schedules alongside one-off calls.
Pharmacy Delivery (5-15 vehicles)
A small pharmacy chain delivering prescriptions across a metro area needed tight time windows and proof of delivery for controlled substances. Their legacy process relied on paper logs and phone confirmations.
Digital proof of delivery — photo capture, signature collection, and delivery notes — replaced paper entirely. Customer SMS notifications with live tracking links reduced “where’s my delivery” calls to the pharmacy front desk, freeing staff to handle in-store customers instead of phone inquiries.
Food Distribution (40-80 vehicles)
A mid-size food distributor running 60 trucks across multiple warehouses dealt with inconsistent route quality depending on which dispatcher built the schedule. Driver assignments didn’t account for vehicle capacity, leading to overloaded trucks on some routes and half-empty ones on others.
Capacity-based routing balanced loads automatically by weight and volume. Real-time GPS tracking gave dispatchers visibility into delays before customers called to complain, and dynamic route adjustments let them reroute drivers mid-shift when last-minute orders came in.
Across these profiles, the common thread is time saved on planning. Zeo’s AI-powered route optimization saves drivers and dispatchers 2+ hours daily — time that gets redirected into more stops per route, faster response to last-minute orders, or simply going home on time.
Calculate Your Own ROI: Interactive Calculator
Generic success stories only tell you what happened to someone else. Your ROI depends on your specific numbers: fleet size, stops per day, fuel costs, and driver wages.
Here’s a simple framework to estimate your own savings before you commit to any software.
Step 1: Calculate current planning time cost.
Multiply your dispatcher’s hourly wage by the hours spent manually building routes each day. A dispatcher earning $25/hour who spends 1.5 hours daily on route planning costs you $37.50/day, or roughly $9,750/year (260 working days).
Step 2: Estimate drive time reduction.
Inefficient routes typically add 10-20% excess drive time compared to optimized routes, according to logistics research published by the American Transportation Research Institute. If your fleet drives 200 miles/day at $0.65/mile (fuel plus maintenance, per IRS standard mileage estimates), a 15% reduction saves roughly $19.50/day per vehicle.
Step 3: Factor in stops-per-day capacity.
If optimized routing lets each driver complete 2-3 more stops per shift without added drive time, calculate the revenue or service value of those extra stops across your fleet size.
Step 4: Add labor efficiency.
Multiply hours saved per driver (Zeo users report 2+ hours daily) by driver hourly wage, across your full fleet, to estimate weekly labor cost efficiency.
Example for a 20-vehicle fleet:
- Dispatcher time saved: ~$9,750/year
- Fuel/mileage savings (15% reduction, 20 vehicles): ~$101,400/year
- Labor efficiency (2 hrs/day × 20 drivers × $20/hr × 260 days): ~$208,000/year in reclaimed labor capacity
These are illustrative estimates based on industry benchmarks, not guarantees. Your actual results depend on your current inefficiency level, fleet size, and how quickly your team adopts the new workflow. Run your own numbers using your actual fuel costs, wages, and stop volume before presenting a business case internally.
The Switch Stories: Migrating from Spreadsheets, Google Maps, and Legacy TMS
Every company evaluating route optimization software is switching from something. Here’s what that transition actually looks like.
From spreadsheets. A small landscaping company (8 crews) managed routes in Excel, manually sorting addresses by neighborhood each morning. The biggest switch challenge wasn’t the software — it was data cleanup. Addresses had typos, duplicate entries, and inconsistent formatting. Bulk address import via CSV let them migrate their stop list in one upload, but they spent roughly two days scrubbing bad addresses first.
From Google Maps. A courier service using Google Maps for individual route navigation had no way to optimize multi-stop sequences or assign stops across multiple drivers. Switching meant retraining drivers who were comfortable with Google’s interface. Zeo’s mobile app supports multiple navigation apps — including Google Maps, Waze, and Apple Maps — so drivers kept their preferred navigation experience while dispatchers gained centralized route planning and tracking.
From legacy TMS. A regional distributor (45 vehicles) was locked into an older transportation management system with clunky integrations and no live customer tracking. Their switch involved migrating recurring route templates and retraining dispatchers on a new interface. The dispatcher team used scheduled/recurring routes to replicate their existing weekly delivery patterns, which shortened the relearning curve significantly.

increase fuel savings
Save $200 on fuel, Monthly!
Optimize routes with our algorithm, reducing travel time and costs efficiently.
Get Started for Free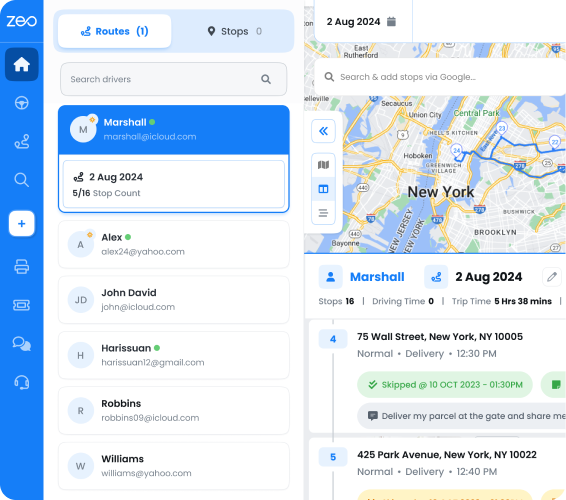
In every switch story, the common success factor wasn’t the software alone — it was driver adoption. Dispatchers can build perfect routes on the web platform, but if drivers don’t use the mobile app consistently, none of the projected savings materialize. Fleet managers evaluating this tradeoff often find it helpful to review a driver retention guide alongside their software rollout plan, since adoption and retention tend to move together.
What Went Wrong First: Honest Failure-to-Fix Stories
No rollout is perfectly smooth. Here are the real friction points companies hit — and how they worked through them.
Driver adoption resistance. A pest control company with 25 technicians rolled out new routing software and immediately hit pushback. Veteran technicians who’d driven the same territories for years didn’t trust an algorithm’s suggested sequence. The fix: dispatchers let drivers use “Navigate as Added” to preserve manual stop order for the first two weeks, building trust before fully switching to AI-optimized sequencing. Adoption improved once technicians saw the optimized routes consistently matched or beat their own instincts.
Messy address data. A food distributor importing 300+ delivery addresses from an old spreadsheet found nearly 15% had incomplete or incorrect addresses, causing failed geocoding during the first import attempt. They had to manually correct entries before bulk uploading again. Lesson: always audit your address list before migration, not after.
Integration hiccups. An e-commerce delivery company connecting Shopify to their routing software found that order tags weren’t mapping correctly to delivery priority settings, causing some rush orders to get routed as standard priority. Their team used Zapier to build a custom workflow that corrected the tag mapping, resolving the issue within a few days.
Underestimating training time. A courier company assumed drivers could self-onboard to the mobile app without formal training. Several drivers struggled with proof-of-delivery steps in week one, slowing down stops. A 20-minute group training session on photo capture and signature collection fixed the bottleneck immediately.
The pattern across all four stories: problems were fixable, but only because teams addressed them early instead of abandoning the switch. Expect friction in week one. Budget time to solve it.
The 30/60/90-Day Rollout Playbook
Here’s a practical timeline for rolling out route optimization software, based on common adoption patterns across fleets of 5-100 vehicles.
Days 1-30: Foundation and pilot.
Start with one route or one small team, not your entire fleet. Import your stop data (bulk upload via Excel, CSV, or Google Sheets) and clean up addresses before go-live. Train your dispatcher on the web platform’s route optimization and driver assignment features. Have your pilot drivers download the Zeo mobile app and walk through receiving a route, navigating with their preferred map app, and submitting proof of delivery. This is the phase where most friction happens — expect it, and resolve issues before scaling.
Days 31-60: Expand and refine.
Roll out to your full fleet once the pilot team is comfortable. Set up time windows, priority stops, and skill-based assignment rules based on what you learned in the pilot. Turn on customer notifications (SMS, email, live tracking links) to start reducing inbound “where’s my order” calls. Review driver performance analytics weekly to spot which drivers need more coaching on the app.
Days 61-90: Optimize and measure.
By day 60, most teams have full driver adoption on the mobile app. Use this phase to measure actual results against your Step 1-4 ROI calculations from earlier. Set up scheduled/recurring routes for predictable delivery patterns. If you’re managing multi-day contracts, use Day Plan to assign different drivers to specific days within a route, or Date Override when a single day needs a substitute without disrupting the full schedule.
Throughout all three phases, remember: your dispatcher’s optimized routes only create value once drivers execute them. Drivers receive their stops directly on the Zeo mobile app, complete with turn-by-turn navigation in their preferred map app and customer details for each stop. If drivers skip the app and revert to memory or paper lists, your ROI calculation falls apart — regardless of how good the web platform’s optimization is.
How to Build Your Own Delivery Optimization Success Story
Use this checklist to evaluate any vendor’s success story — including the ones in this article.
The Credibility Checklist:
- [ ] Does the story include a specific percentage or dollar figure, not a vague range?
- [ ] Is the fleet size, industry, or use case comparable to yours?
- [ ] Does it disclose a timeframe (30 days? 6 months?) for results?
- [ ] Does it mention a “before” state you can compare against your own current process?
- [ ] Does it acknowledge any rollout friction, or does it sound flawless?
- [ ] Can you verify the claim independently (case study page, customer review, reference call)?
The ROI Template:
Before switching software, document these five numbers using your actual operations:
- Current dispatcher hours spent on manual route planning per week
- Current average miles driven per vehicle per day
- Current fuel and maintenance cost per mile
- Current average stops completed per driver per shift
- Current driver hourly wage and total driver headcount
Run these through the ROI framework from earlier in this article. Then pilot any software with one team for 30 days and measure the same five numbers again. The difference is your real, verifiable success story — not a vendor’s.
This is also exactly how you should evaluate Zeo. Request a demo, ask for references in your industry and fleet size range, and run a free trial with your actual stop data before committing. According to the Bureau of Labor Statistics transportation industry data, transportation and warehousing operations are under continued pressure to improve efficiency amid rising fuel and labor costs — which makes a verified pilot more valuable than a sales pitch.
Delivery optimization success stories should be checkable, specific, and honest about what didn’t work at first. That’s the standard this article tried to meet, and it’s the standard you should hold any vendor to, including Zeo.
Frequently Asked Questions
Q: How long does it take to see results from delivery optimization software?
Most teams see measurable results within 30-60 days, with full stabilization by day 90 as dispatchers and drivers adjust their workflows. A pilot program with one route or small team is the fastest way to validate results before a full fleet rollout. Rushing adoption across an entire fleet in week one typically produces worse data than a phased approach.
Q: What’s a realistic ROI timeline for a small delivery fleet?
For a fleet of 10-20 vehicles, dispatcher time savings often show up immediately (within the first week), while fuel and labor efficiency gains typically take 30-60 days to stabilize as routes and driver habits adjust. Zeo Route Planner users report saving 2+ hours daily on planning and driving time once adoption is consistent across the team. Running your own 30-day pilot with real stop data is the most reliable way to confirm your specific numbers.
Q: How do I know if a vendor’s success story is legitimate or just marketing?
Legitimate success stories include specific percentages (not vague ranges), a disclosed timeframe, a clear before-and-after baseline, and some acknowledgment of rollout friction. If a case study sounds flawless from day one with no mention of driver pushback or data cleanup, treat it with skepticism. Ask the vendor for a reference call or a free trial with your own data instead of relying on the published case study alone.
Q: What causes most delivery route optimization rollouts to fail?
The most common failure point isn’t the software itself — it’s driver adoption. If dispatchers build optimized routes on a web platform but drivers don’t consistently use the companion mobile app for navigation and proof of delivery, the projected time and fuel savings never materialize. Messy address data and skipped driver training are the next most common causes of a rocky rollout.
Q: Can I calculate delivery optimization ROI before switching software?
Yes — document your current dispatcher planning hours, average miles driven per vehicle, fuel/maintenance cost per mile, stops completed per driver shift, and driver hourly wages. Run those five numbers through a basic savings framework, then pilot any software with one team for 30 days and remeasure the same five numbers. That comparison gives you a verifiable ROI figure instead of relying on a vendor’s advertised average.
—
Start a free Zeo Route Planner trial and build your own success story — or book a live demo to see how fleets your size cut delivery costs and drive time in the first 30 days.
Are you a fleet owner?
Want to manage your drivers and deliveries easily?
Grow your business effortlessly with Zeo Routes Planner – optimize routes and manage multiple drivers with ease.

increase fuel savings
Hassle Free Deliveries & Pickups!
Optimize routes with our algorithm, reducing travel time and costs efficiently.
Get Started for Free