

# Government Route Optimization Case Study: Real ROI Results
> TL;DR: Government agencies implementing route optimization achieve 25-35% fuel reduction and full ROI within 8-12 months through measurable taxpayer savings. Real municipal case studies show $200K+ annual savings per department with documented proof. Route optimization tools like Zeo Route Planner address these challenges with AI-powered routing and real-time GPS tracking, helping government fleets save 2+ hours daily on administrative tasks.
Government agencies implementing government route optimization case study programs face intense scrutiny over every dollar spent. When it comes to fleet technology investments, the pressure to prove measurable taxpayer value has never been higher.
This comprehensive government route optimization case study analysis examines real municipal implementations, complete with documented savings, procurement processes, and replicable blueprints for public sector success.
The Government Fleet Challenge: Why Traditional Route Planning Fails Public Service
Government fleets operate under constraints private companies rarely face. Budget cycles span years, not quarters. Every purchase requires justification to oversight committees. Staff turnover disrupts institutional knowledge.
Traditional route planning amplifies these challenges. Manual routing wastes taxpayer dollars through inefficient fuel consumption and overtime costs. Paper-based systems create accountability gaps. Disconnected departments duplicate efforts across the same geographic areas.
According to the Government Fleet Management Association, public agencies waste an average of 23% of their operational budget on inefficient routing and scheduling. For a mid-sized city managing 100 vehicles, this translates to $400,000+ in annual waste.
The complexity multiplies across departments. Waste collection follows rigid schedules. Social services prioritize urgent cases. Parks maintenance balances seasonal demands. Each operates independently, missing optimization opportunities that could serve taxpayers better.
Case Study 1: City of Springfield Waste Management – 35% Fuel Reduction, $200K Annual Savings
Springfield’s Public Works Department managed 45 waste collection vehicles serving 85,000 residents. Their challenge: rising fuel costs and aging infrastructure strained budgets while service complaints increased.
The Problem:
Manual route planning took supervisors 4+ hours weekly. Drivers often backtracked through neighborhoods, increasing fuel consumption and wear. Customer complaints about missed pickups averaged 150 monthly. Overtime costs exceeded budget by 18%.
The Solution:
Springfield implemented AI-powered route optimization to streamline operations. The system automatically assigned optimal routes to drivers through mobile apps, enabling real-time vehicle tracking and customer notifications through comprehensive fleet management software.
Measurable Results After 12 Months:
- 35% reduction in fuel consumption ($125,000 annual savings)
- 28% decrease in overtime costs ($75,000 annual savings)
- 67% reduction in customer complaints (from 150 to 50 monthly)
- 2.3 hours saved per supervisor weekly on route planning
Key Implementation Factors:
Springfield’s success stemmed from systematic change management. They trained supervisors first, then rolled out mobile apps to drivers in phases. Union representatives participated in pilot testing, ensuring buy-in before full deployment.
The city council received monthly progress reports showing exact savings figures. This transparency built support for expanding the system to other departments.
Case Study 2: County Health Department Home Visits – 40% More Patients Served Daily
Metro County Health Department’s Community Health Workers served 12,000+ residents through home visits. Their mission-critical challenge: serve more vulnerable populations with existing staff levels.
The Operational Challenge:
Nurses spent 3+ hours daily on travel between patient visits. Paper-based scheduling created gaps in coverage. Emergency visits disrupted planned routes. Documentation requirements added administrative burden.
The Strategic Solution:
The department deployed route optimization with healthcare-specific features. Time windows ensured patient availability. Priority settings handled urgent cases. Digital proof of delivery captured required documentation.
Documented Impact:
- 40% increase in daily patient visits (from 8 to 11.2 average per nurse)
- 45 minutes less travel time per nurse daily
- 89% improvement in appointment punctuality
- Complete digital documentation for compliance audits
Healthcare-Specific Benefits:
Nurses received optimized routes on mobile devices, complete with patient information and visit requirements. GPS tracking provided safety oversight for staff working in remote areas. Automatic customer notifications reduced missed appointments by 34%.
The system’s proof of delivery features captured patient signatures and visit photos, creating comprehensive audit trails required by state health regulations.
Government Procurement Playbook: RFP Templates, Vendor Evaluation, and Approval Process
Government procurement demands structured evaluation processes that withstand public scrutiny. Here’s a proven framework for route optimization vendor selection.
RFP Requirements Template
Technical Specifications:
- Multi-platform compatibility (web dashboard, mobile apps)
- Real-time GPS tracking and driver communication
- Integration capabilities with existing government systems
- Scalability to handle department expansion
- Data security meeting federal standards
Vendor Qualification Criteria:
- Minimum 3 years serving government clients
- References from similar-sized public agencies
- Financial stability documentation
- Local support and training capabilities
- Compliance with accessibility standards
Evaluation Scoring Matrix
Cost Analysis (30%):
- Total cost of ownership over 5 years
- Implementation and training expenses
- Ongoing support and maintenance fees
- Hidden costs evaluation
Technical Capabilities (40%):
- Feature completeness against requirements
- System reliability and uptime guarantees
- Integration complexity and timeline
- Mobile app functionality for field staff
Vendor Stability (20%):
- Government client portfolio
- Financial health indicators
- Support team experience
- Local presence and response times
References and Demos (10%):
- Similar agency implementations
- Measurable results documentation
- Live system demonstrations
- Pilot program availability
Approval Process Navigation
Present proposals using taxpayer impact language. Focus on service improvements rather than technology features. Quantify benefits in terms oversight committees understand: reduced response times, increased service capacity, lower operational costs.
Include environmental benefits in proposals. Route optimization software typically reduces vehicle emissions by 20-30%, supporting sustainability mandates many governments face.
ROI Calculator: Proving Taxpayer Value with Environmental Impact and Cost Savings Metrics
Government ROI calculations must account for both direct savings and public value creation. Use this framework to build compelling business cases.

increase fuel savings
Save $200 on fuel, Monthly!
Optimize routes with our algorithm, reducing travel time and costs efficiently.
Get Started for Free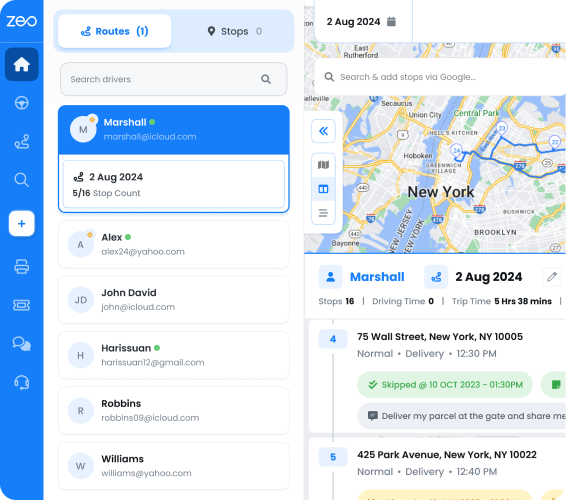
Direct Cost Savings Calculation
Fuel Reduction Formula:
- Current annual fuel cost × optimization percentage (typically 25-35%)
- Example: $200,000 annual fuel × 30% reduction = $60,000 savings
Labor Efficiency Gains:
- Administrative time saved × hourly rate × annual hours
- Example: 3 hours weekly saved × $35/hour × 50 weeks = $5,250 per administrator
Overtime Reduction:
- Current overtime costs × reduction percentage (typically 15-25%)
- Example: $150,000 overtime × 20% reduction = $30,000 savings
Service Improvement Metrics
Response Time Enhancement:
- Faster emergency response improves public safety outcomes
- Increased service capacity serves more residents with existing resources
- Reduced complaint resolution time improves citizen satisfaction
Environmental Impact Quantification:
According to EPA data, every gallon of gasoline burned produces 19.6 pounds of CO2. A 30% fuel reduction for a 50-vehicle fleet saves approximately 15,000 gallons annually, preventing 147 tons of CO2 emissions.
Modern AI-powered route optimization systems make these calculations automatic, providing government agencies with detailed environmental impact reports for sustainability reporting.
Multi-Year ROI Projection
Year 1: Implementation costs offset by immediate fuel and overtime savings
Year 2-3: Full operational savings plus service improvement benefits
Year 4-5: Accumulated savings fund additional public services or infrastructure
Most government route optimization implementations achieve full ROI within 8-12 months, then generate ongoing taxpayer value according to Bureau of Labor Statistics transportation cost analysis.
Implementation Blueprint: System Integration, Training, and Change Management for Government Agencies
Successful government implementations require structured change management addressing both technical and cultural challenges.
Phase 1: Foundation Setting (Weeks 1-4)
Stakeholder Alignment:
- Department head briefings on expected outcomes
- Union representative inclusion in planning process
- IT department integration requirements review
- Budget office reporting structure establishment
Technical Preparation:
- Existing system integration assessment
- Data migration planning and execution
- Security compliance verification
- Hardware and connectivity requirements
Phase 2: Pilot Implementation (Weeks 5-8)
Limited Deployment:
- Select 3-5 drivers for initial testing
- Single department focus for complexity management
- Daily feedback collection and system adjustments
- Performance metric baseline establishment
Training Program:
- Supervisor dashboard training (2-hour sessions)
- Driver mobile app training (30-minute individual sessions)
- Customer service staff notification system training
- Ongoing support process establishment
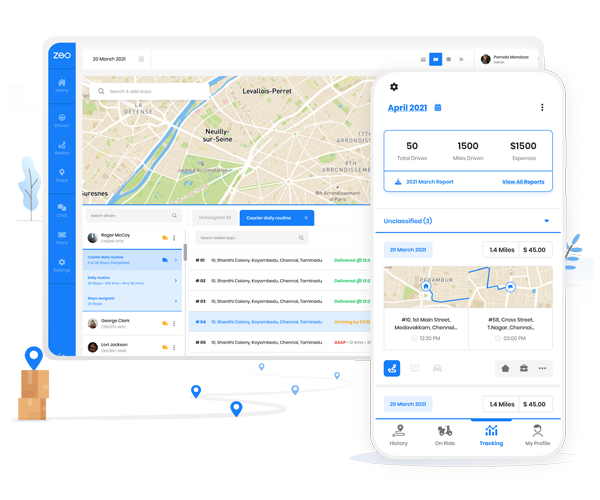
Zeo Route Planner streamlines this process through dedicated government implementation support. The platform’s fleet management dashboard allows supervisors to monitor all vehicles in real-time while drivers receive optimized routes directly on their mobile devices, creating seamless coordination between management and field staff.
Phase 3: Full Deployment (Weeks 9-16)
Systematic Rollout:
- Department-by-department implementation schedule
- Performance monitoring and adjustment protocols
- Issue escalation and resolution procedures
- Success metric documentation and reporting
Change Management:
- Regular all-hands meetings showing progress metrics
- Recognition programs for early adopters
- Continuous training and support availability
- Integration with existing government procedures
Phase 4: Optimization and Expansion (Months 5-12)
Performance Enhancement:
- Advanced feature utilization (time windows, priority stops)
- Cross-department coordination opportunities
- Additional vehicle and staff integration
- System capability expansion based on success
Reporting and Accountability:
- Monthly council presentations with savings documentation
- Annual budget impact reports for future planning
- Public transparency reports highlighting efficiency improvements
- Best practice documentation for other departments
The key to government implementation success lies in treating route optimization as operational improvement, not just technology adoption. Focus training on how the system enhances existing workflows rather than replacing them entirely.
Zeo’s government clients typically see measurable improvements within 30 days, with full ROI achieved within the first year through combined fuel savings, reduced overtime costs, and improved service delivery metrics.
Frequently Asked Questions
Q: How long does it typically take government agencies to see ROI from route optimization investments?
Most government route optimization implementations achieve full ROI within 8-12 months through combined fuel savings, reduced overtime costs, and improved service delivery metrics. The initial implementation period typically spans 3-4 months, with measurable improvements visible within 30 days.
Q: What procurement requirements must route optimization software meet for government use?
Government route optimization software must meet federal security standards, provide accessibility compliance, offer transparent pricing with no hidden costs, and include references from similar-sized public agencies. Vendors should demonstrate financial stability and local support capabilities during the RFP process.
Q: Can route optimization software integrate with existing government fleet management systems?
Yes, modern route optimization platforms like Zeo Route Planner offer API integrations and can connect with existing government systems through platforms like Zapier. Integration capabilities should be evaluated during the procurement process to ensure seamless data flow between systems.
Q: How do government agencies measure the environmental impact of route optimization?
Agencies typically track fuel consumption reduction, which directly correlates to emissions savings. Every gallon of gasoline saved prevents 19.6 pounds of CO2 emissions according to EPA data. Most implementations achieve 25-35% fuel reduction, supporting government sustainability mandates.
Q: What training is required for government staff to use route optimization systems effectively?
Training typically includes 2-hour sessions for supervisors on dashboard management and 30-minute individual sessions for drivers on mobile app usage. Zeo Route Planner provides dedicated government implementation support with systematic rollout phases to ensure successful adoption across departments.
—
Ready to build your government route optimization case study? Request a demo specifically designed for public sector needs, complete with ROI analysis, compliance documentation, and implementation timeline tailored to government procurement processes.
Are you a fleet owner?
Want to manage your drivers and deliveries easily?
Grow your business effortlessly with Zeo Routes Planner – optimize routes and manage multiple drivers with ease.
increase fuel savings
Save $200 on fuel, Monthly!
Optimize routes with our algorithm, reducing travel time and costs efficiently.
Get Started for Free