
# How to Reduce Vending Machine Service Costs by 40% in 2026
Vending machine operators face razor-thin margins and rising operational costs. With fuel prices climbing and labor shortages driving up wages, every inefficiency hits your bottom line hard.
The good news? You can reduce vending machine service costs by 30-40% without cutting service quality. The secret lies in optimizing your operations through smart routing, data-driven decisions, and modern mobile technology.
Let’s dive into the strategies that successful vending operators use to slash costs while improving service reliability.
The Hidden Costs Killing Vending Machine Profitability: Why Traditional Service Models Fail
Most vending operators underestimate their true service costs. You’re not just paying for technician wages and fuel. Hidden costs drain profits every day.
Inefficient routing is the biggest culprit. When technicians zigzag across town or backtrack to locations, you’re burning fuel and paying for unproductive drive time. A technician spending 4 hours driving and 4 hours actually servicing machines is only 50% productive.
Unnecessary service visits compound the problem. Servicing machines that don’t need restocking or maintenance wastes resources. Many operators still use fixed schedules instead of demand-based servicing.
Poor inventory management creates a domino effect. Technicians arrive at locations without the right products or parts. They either make a second trip (doubling costs) or leave machines empty (losing sales revenue).
Lack of visibility into technician productivity makes it impossible to optimize operations. Without real-time data, you can’t identify inefficiencies or bottlenecks until they become expensive problems.
Consider this scenario: Your technician drives 45 minutes to service a snack machine, only to find it’s 80% full. Then they drive another 30 minutes to a drink machine that’s been empty for two days. That’s 75 minutes of drive time for work that should have been prioritized and combined into an efficient route.
Traditional service models treat every machine equally. Smart operators know that high-traffic locations need different service frequencies than low-volume machines. They use data to make these decisions instead of gut instinct.
Route Optimization for Vending Service Costs: Reducing Travel Time and Fuel Costs by 40%
Route optimization transforms your service operations overnight. Instead of letting technicians plan their own routes or using static territories, you can cut travel time by 40% or more.
Start by mapping all your locations and analyzing service patterns. Group nearby machines into logical clusters. Identify which locations need daily, weekly, or monthly service based on historical data.
Use route optimization software to plan efficient daily routes. Modern platforms like Zeo Route Planner can optimize routes for multiple technicians simultaneously, considering factors like machine priority, service time windows, and technician skills.
Consider time windows for each location. Office buildings might require morning service, while schools need afternoon restocking. Restaurants may prefer service during slow periods. Build these constraints into your routing.
Plan for mixed service types on the same route. Combine restocking, maintenance, and collection stops efficiently. A technician can restock machines in the morning, handle maintenance calls midday, and collect cash in the afternoon—all following an optimized path.
Dynamic routing helps you handle emergency calls without destroying your planned routes. When a machine breaks down or runs empty, smart routing algorithms can determine which technician can respond fastest without disrupting other stops.
Real-world example: A Chicago-based vending operator reduced their fleet from 8 service vehicles to 6 by optimizing routes. They saved $48,000 annually on vehicle costs alone, plus fuel and insurance savings.
Track and measure your routing improvements. Monitor metrics like miles driven per stop, fuel costs per machine serviced, and technician utilization rates. These numbers will guide further optimizations according to Federal Motor Carrier Safety Administration fuel efficiency guidelines.
Data-Driven Service Scheduling: Using Analytics to Predict Optimal Restocking and Maintenance Windows
Smart scheduling eliminates unnecessary trips and ensures machines never run empty. Use data to predict when machines need service instead of guessing.
Analyze sales velocity for each machine and product type. High-traffic locations might need daily restocking, while others can go a week. Seasonal patterns affect demand—cold drinks sell faster in summer, hot beverages peak in winter.
Track machine reliability to predict maintenance needs. Machines showing declining sales or frequent error codes need attention before they break down completely. Preventive maintenance costs less than emergency repairs.
Use telemetry data from smart vending machines to make real-time decisions. Sensors can report inventory levels, cash box status, and mechanical issues. This data eliminates guesswork and prevents empty machines.
Segment machines by service frequency. Create daily, weekly, and monthly service schedules based on actual data:
- High-volume locations (offices, schools): Every 2-3 days
- Medium-volume locations (gyms, small offices): Weekly
- Low-volume locations (break rooms): Bi-weekly or monthly
Implement dynamic scheduling that adjusts based on real-time conditions. If a machine sells out faster than expected, bump it up in the priority queue. If sales are slow, extend the service interval.
Consider external factors that affect demand. Weather, local events, and seasonal changes impact vending sales. A machine near a baseball stadium needs extra attention on game days.
Example: A vending operator in Phoenix noticed their outdoor machines needed daily restocking in summer but could go three days in winter. By adjusting schedules seasonally, they reduced service costs by 25% while improving product availability.
Create service level agreements internally. Define acceptable out-of-stock percentages and response times for different location types. This helps balance service costs with revenue protection.
Mobile Technology for Technicians: Real-time Updates, Inventory Tracking, and Efficiency Gains
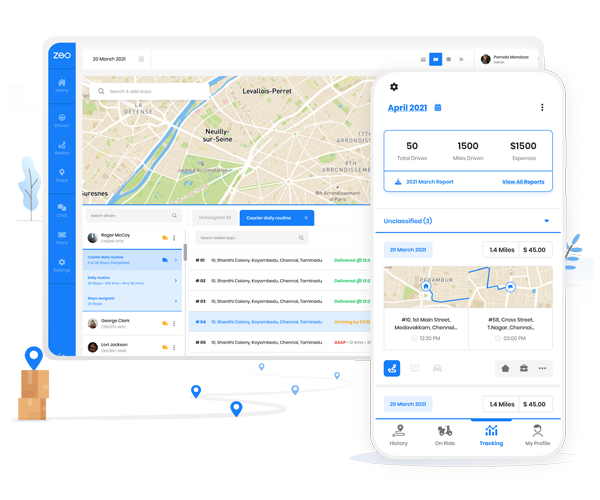
Mobile technology connects your office operations with field technicians, creating seamless communication and real-time visibility into service operations through comprehensive field service management solutions.
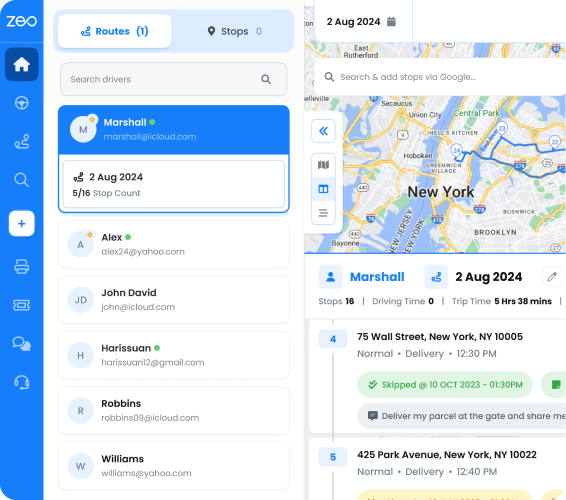
Your technicians receive optimized routes directly on their phones via mobile apps like Zeo, complete with turn-by-turn navigation and machine details. They can see service history, inventory requirements, and special instructions before arriving at each location.
Real-time GPS tracking keeps dispatchers informed about progress. Technicians mark tasks complete, report issues, and request support instantly. This visibility helps you manage customer expectations and respond to problems quickly.
Digital inventory tracking eliminates paperwork and reduces errors. Technicians scan products during restocking and the system automatically updates inventory levels. This data feeds back into demand forecasting and purchasing decisions.
Photo documentation provides proof of service and helps diagnose problems. Technicians can photograph machine conditions, error displays, or damage. These images help with warranty claims and maintenance planning.
Automatic customer notifications improve service transparency. When a technician completes service, customers can receive automatic updates about machine status, new products, or service schedules.
Digital cash collection records improve security and accuracy. Technicians photograph cash counts and record collection amounts digitally. This creates an audit trail and reduces discrepancies.
GPS tracking provides route compliance verification and helps optimize future schedules. You can see actual travel times between locations and identify traffic patterns that affect efficiency.
Integration with inventory systems ensures technicians carry the right products. The mobile app can display current truck inventory and flag potential shortages before technicians reach locations.
Real-world impact: A vending operator in Dallas reduced service call completion time by 35% after implementing mobile technology. Technicians spent less time on paperwork and more time actually servicing machines.
Emergency Response Planning: Minimizing Downtime Through Smart Routing and Priority Systems
Machine breakdowns and out-of-stock situations cost you money every hour they remain unresolved. Smart emergency response planning minimizes revenue loss and keeps customers satisfied through effective fleet management strategies.
increase fuel savings
Hassle Free Deliveries & Pickups!
Optimize routes with our algorithm, reducing travel time and costs efficiently.
Get Started for Free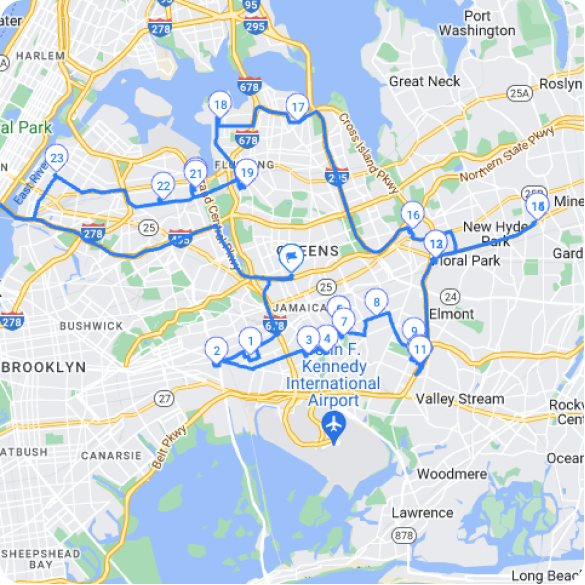
Create response priority levels based on location value and problem type:
- Priority 1: High-revenue locations with complete machine failures
- Priority 2: Medium-revenue locations or partial service issues
- Priority 3: Low-revenue locations with minor problems
Implement geographic response zones so technicians can handle emergencies in their areas without major route disruptions. Each zone should have backup coverage when the primary technician is unavailable.
Use dynamic routing to insert emergency calls into existing routes efficiently. Instead of sending a technician across town for one emergency call, the system finds the nearest available technician and adjusts their route accordingly.
Stock emergency inventory strategically across your service area. Keep high-demand products and common parts at satellite locations or in service vehicles. This reduces response time and eliminates multiple trips.
Set up automated alerts for critical situations. When telemetry data shows a machine breakdown or unusual patterns, the system should automatically notify the appropriate technician and dispatcher.
Track emergency response metrics to improve your processes:
- Average response time by priority level
- First-call resolution rate
- Revenue lost due to machine downtime
- Customer satisfaction scores for emergency service
Cross-train technicians on different types of equipment and issues. This flexibility allows any available technician to handle most emergency calls instead of waiting for specialists.
Example scenario: A drink machine at a busy office building breaks down on Monday morning. Your smart routing system identifies the nearest technician, who’s currently servicing machines 10 minutes away. The system adjusts his route to include the emergency stop and provides diagnostic information before he arrives. Total downtime: 45 minutes instead of 4+ hours.
Communicate proactively with location managers about service issues. Automated notifications can inform them about problems and estimated repair times, maintaining good relationships even during disruptions.
Measuring Success: KPIs and Cost-Reduction Metrics That Matter for Vending Operations
You can’t improve what you don’t measure. Track the right metrics to ensure your cost-reduction efforts deliver real results, following industry benchmarks for optimal performance.
Service cost per machine per month is your primary metric. Calculate total service costs (labor, fuel, vehicle, overhead) divided by the number of machines serviced. Track this monthly to identify trends and measure improvements.
Miles driven per service call indicates routing efficiency. Lower numbers mean better route optimization. Track this by technician and route to identify improvement opportunities.
Technician utilization rates show how much time technicians spend on productive work versus travel time. Aim for 70%+ productive time. Calculate as: (Service time) / (Total work hours) × 100.
Service call accuracy measures how often technicians correctly assess machine needs. Track unnecessary visits (machines didn’t need service) and callback rates (problems not fully resolved). Target less than 10% for both metrics.
Fuel cost per machine serviced directly reflects routing efficiency and vehicle utilization. Monitor this weekly to catch rising costs early.
Average service response time for different priority levels ensures you’re meeting service commitments. Track separately for routine service and emergency calls.
Out-of-stock incidents indicate scheduling effectiveness. Measure both frequency and duration of stockouts. Each hour a high-traffic machine sits empty costs revenue.
Revenue per machine per service visit helps optimize service frequency. If this metric is declining, you might be servicing too frequently or need better product mix optimization.
Create a monthly dashboard that displays these metrics visually. Share it with your operations team to maintain focus on efficiency improvements.
Benchmark against industry standards and your own historical performance. A good vending operation should see:
- Service costs under $35 per machine per month
- Less than 15 miles driven per service call
- Technician utilization above 70%
- Emergency response under 4 hours
Calculate return on investment for optimization initiatives. If route optimization software costs $200/month but saves $800 in fuel and labor, that’s a 300% ROI.
Set quarterly improvement targets based on your baseline metrics. Even small improvements compound over time. A 5% reduction in service costs across 500 machines saves $10,500 annually.
Frequently Asked Questions
Q: What are the biggest costs in vending machine service operations?
The largest costs are typically labor (40-50% of total service costs), fuel and vehicle expenses (20-25%), and inventory management inefficiencies. Hidden costs like unnecessary service visits and poor routing can add 30-40% to your total operational expenses. Using route optimization software like Zeo Route Planner can help identify and eliminate many of these hidden costs.
Q: How often should vending machines be serviced to minimize costs?
Service frequency should be data-driven rather than schedule-based. High-traffic locations typically need service every 2-3 days, medium-volume locations weekly, and low-volume locations bi-weekly or monthly. The key is using sales velocity data and telemetry from smart machines to determine optimal service intervals for each location.
Q: Can route optimization really reduce vending service costs by 40%?
Yes, route optimization can achieve 30-40% cost reductions by eliminating inefficient routing, reducing drive time, and improving technician productivity. Zeo Route Planner has helped vending operators reduce their fleet size while maintaining service quality, with some saving over $48,000 annually on vehicle costs alone plus additional fuel and labor savings.
Q: What technology should vending operators invest in first?
Start with route optimization software and mobile apps for technicians. These provide immediate ROI by reducing travel time and improving communication. Next, consider telemetry systems for real-time inventory tracking and predictive maintenance. Digital proof of delivery and GPS tracking complete the essential technology stack for modern vending operations.
Q: How do I measure if my cost reduction efforts are working?
Track key metrics including service cost per machine per month (target: under $35), miles driven per service call (target: under 15 miles), technician utilization rates (target: 70%+), and out-of-stock incidents. Create a monthly dashboard to monitor these KPIs and calculate ROI on your optimization initiatives to ensure continuous improvement.
Start Reducing Your Vending Service Costs Today
Reducing vending machine service costs by 30-40% isn’t just possible—it’s happening right now for operators who embrace smarter operations.
The strategies we’ve covered work together to create compound savings. Better routing reduces fuel costs. Data-driven scheduling eliminates unnecessary trips. Mobile technology improves technician productivity. Smart emergency response minimizes revenue loss.
Start your free trial of Zeo Route Planner to see how much you can save on your vending service operations. You’ll get instant visibility into potential improvements and can start optimizing routes immediately.
Your margins depend on operational efficiency. Every mile you don’t drive and every unnecessary service call you avoid drops straight to your bottom line.
Are you a fleet owner?
Want to manage your drivers and deliveries easily?
Grow your business effortlessly with Zeo Routes Planner – optimize routes and manage multiple drivers with ease.

increase fuel savings
Save $200 on fuel, Monthly!
Optimize routes with our algorithm, reducing travel time and costs efficiently.
Get Started for Free