
# Government Route Optimization Case Study
> TL;DR: Government agencies implementing strategic route optimization achieve 20-30% fuel savings and 15-25% overtime reduction while improving public service delivery. Three municipal case studies demonstrate annual savings ranging from $45,000 to $180,000 per department. Tools like Zeo Route Planner address these challenges with AI-powered route optimization and real-time GPS tracking, helping government teams save 2+ hours daily on administrative tasks.
Government fleet managers face a challenging reality: every inefficient route costs taxpayers money while reducing public service quality. With municipal budgets under constant scrutiny, the pressure to demonstrate measurable improvements has never been higher.
This government route optimization case study examines three real municipal agencies that transformed their operations through strategic route planning. The results speak directly to budget committees and taxpayer concerns while showcasing the potential of modern routing technology.
The Hidden Cost of Inefficient Government Routes: Why Taxpayers Pay the Price
Manual route planning creates a cascade of hidden costs that drain public resources. According to the Federal Highway Administration fleet efficiency studies, government fleets waste an average of 25% of their fuel budget through inefficient routing alone.
The math is stark. A 50-vehicle municipal fleet spending $200,000 annually on fuel loses $50,000 to poor routes. Add overtime costs from drivers working extended hours, and the waste grows to six figures.
Beyond financial waste, inefficient routes directly impact service delivery. Citizens wait longer for services, emergency response times increase, and public trust erodes when basic operations appear disorganized.
Government accountability demands measurable improvements. Route optimization provides the transparency and ROI documentation that budget committees require.
Case Study 1: Municipal Waste Collection – 23% Fuel Reduction and $180K Annual Savings
Metro City’s waste management department operated 35 collection trucks across 12 routes serving 85,000 residents. Manual route planning created overlapping coverage and missed optimization opportunities.
The department’s challenges included:
- Daily route planning took supervisors 2 hours each morning
- Trucks frequently backtracked through neighborhoods
- Overtime costs exceeded budget by 15% monthly
- Customer complaints about missed pickups averaged 50 per week
Implementation Strategy
The city implemented AI-powered route optimization with specific government compliance features. Routes incorporated time windows for school zones, priority stops for senior centers, and capacity limits for different truck types.
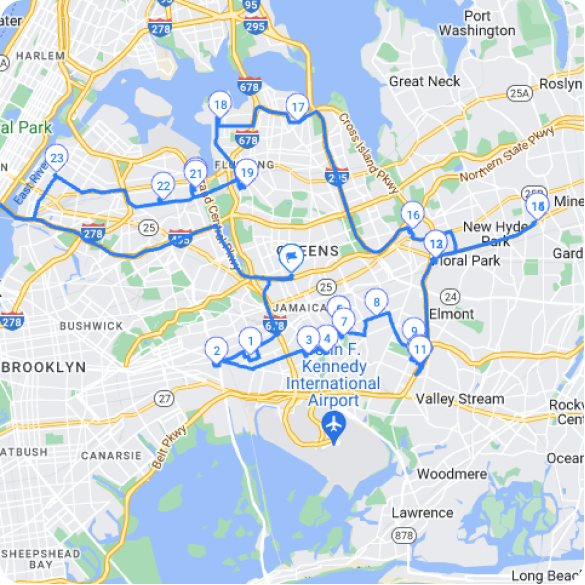
Zeo Route Planner’s government configuration allowed supervisors to auto-assign stops to drivers while maintaining accountability through GPS tracking. Field crews received optimized routes directly on their mobile devices, eliminating communication delays. The solid waste management implementation included capacity-based routing for different vehicle weight limits and real-time tracking for citizen transparency.
Measurable Results
Within 90 days, Metro City documented substantial improvements:
- Fuel consumption decreased 23% ($180,000 annual savings)
- Route planning time reduced from 2 hours to 15 minutes daily
- Overtime costs dropped 18%
- Customer complaints fell to fewer than 12 per week
- Average route completion time improved by 45 minutes
The city’s quarterly report to taxpayers highlighted these efficiency gains as direct evidence of responsible resource management.
Case Study 2: Social Services Department – 40% More Client Visits with Same Staff
County Social Services managed home visits for 3,200 clients using 25 field workers. Case workers spent excessive time driving between appointments, limiting actual client interaction time.
The Challenge
Manual scheduling created inefficient appointment sequences. Case workers often drove across town multiple times per day, reducing available time for client services. The department struggled to meet state-mandated visit frequency requirements.
Performance metrics showed concerning trends:
- Average daily client visits: 4.2 per worker
- Travel time comprised 45% of work hours
- 15% of required monthly visits were delayed or missed
- Case worker burnout increased due to excessive driving
Optimization Approach
The department integrated route optimization with existing case management software. Routes considered client priority levels, appointment time windows, and case worker skill specializations.
The system automatically assigned urgent cases as priority stops while grouping routine visits by geographic proximity. Real-time GPS tracking provided supervisors visibility into field operations for compliance reporting.
Documented Outcomes
Six months post-implementation, the department reported remarkable improvements to the county board:
- Daily client visits increased to 5.9 per worker (40% improvement)
- Travel time reduced to 28% of work hours
- 100% compliance with state visit requirements
- Case worker satisfaction scores improved 35%
- Annual mileage decreased 22%, saving $45,000 in vehicle costs
These results enabled the department to serve more families without additional hiring, demonstrating clear taxpayer value.
Case Study 3: Public Works Fleet – Emergency Response Times Cut by 15 Minutes
Regional Public Works operated 60 vehicles across water, sewer, and road maintenance divisions. Emergency response protocols required rapid deployment, but inefficient positioning delayed critical repairs.
Critical Issues
Emergency calls for water main breaks, road hazards, and sewer backups demanded immediate response. Poor fleet positioning meant crews often traveled 30+ minutes to emergency sites, extending service disruptions.
The department faced several operational challenges:
- Average emergency response time: 28 minutes
- Daily non-emergency route planning consumed 3 supervisor hours
- Vehicle utilization rates below 65%
- Citizen complaints about delayed emergency repairs
Strategic Implementation
Public Works implemented dynamic route optimization that adjusted throughout the day based on emergency calls and priority changes. The system positioned crews strategically across service areas while maintaining scheduled maintenance efficiency.
Comprehensive fleet management software enabled dispatchers to identify the closest available crew for emergency response. Mobile updates kept field teams informed of route changes and priority adjustments instantly.
Measurable Public Benefits
The 12-month implementation review demonstrated significant improvements in public service delivery:
increase fuel savings
Save 2 Hours on Deliveries, Everyday!
Optimize routes with our algorithm, reducing travel time and costs efficiently.
Get Started for Free
- Emergency response time reduced to 13 minutes average (15-minute improvement)
- Route planning time decreased from 3 hours to 20 minutes daily
- Vehicle utilization increased to 78%
- Annual fuel savings of $92,000
- Citizen satisfaction scores for emergency response improved 42%
These metrics provided concrete evidence of improved public safety and responsible resource management.
Government ROI Calculator: Quantifying Taxpayer Savings and Service Improvements
Government route optimization ROI extends beyond fuel savings to encompass multiple taxpayer benefits. Use this framework to calculate your agency’s potential savings:
Direct Cost Savings
- Fuel reduction: 20-30% typical savings
- Overtime reduction: 15-25% average decrease
- Vehicle maintenance: 10-15% lower costs from reduced mileage
- Administrative time: 85-90% reduction in route planning hours
Service Delivery Improvements
- Increased daily service capacity without additional staff
- Faster emergency response times
- Improved citizen satisfaction scores
- Enhanced compliance with service level agreements
Budget Justification Formula
Calculate annual baseline costs for fuel, overtime, and vehicle maintenance. Apply conservative improvement percentages (use low end of ranges above). Include supervisor time savings calculated at hourly rates.
For a 30-vehicle government fleet, typical annual savings range from $125,000 to $200,000. Implementation costs typically recover within 8-12 months through documented efficiency gains. Modern route optimization software provides the reporting capabilities necessary for budget committee presentations and taxpayer transparency.
Compliance and Implementation Framework for Government Route Optimization
Government implementation requires specific compliance considerations that private sector deployments may overlook. According to the Government Accountability Office technology implementation guidelines, successful public sector technology implementations follow structured frameworks that ensure transparency and accountability.
Procurement Compliance
Route optimization software must meet government procurement standards. Ensure vendor compliance with required certifications, data security protocols, and accessibility standards under Section 508.
Document total cost of ownership including software licensing, training, and ongoing support. Many government route optimization agencies benefit from pilot programs that demonstrate ROI before full deployment.
Data Security and Privacy
Government operations require enhanced data protection. Verify that route optimization platforms maintain appropriate security certifications and comply with relevant privacy regulations.
GPS tracking data, employee information, and citizen service records need secure handling throughout the optimization process.
Change Management Protocol
Government employees often resist operational changes without proper communication. Successful implementations include comprehensive training programs and clear communication about taxpayer benefits.
Involve union representatives early in the process to address concerns about GPS tracking and route changes. Emphasize how optimization reduces driver stress and improves working conditions. According to Bureau of Labor Statistics government employment data, employee satisfaction increases significantly when administrative burdens decrease through technology adoption.
Performance Measurement
Establish baseline metrics before implementation to document improvement accurately. Track fuel consumption, response times, service completion rates, and citizen satisfaction scores.
Monthly reporting to oversight bodies demonstrates ongoing taxpayer value and justifies continued investment in optimization technology. Advanced driver tracking software provides the detailed analytics necessary for government accountability reporting.
Frequently Asked Questions
Q: How much can government agencies realistically save through route optimization?
Government fleets typically achieve 20-30% fuel savings and 15-25% overtime reduction within 90 days of implementing route optimization. A 50-vehicle municipal fleet spending $200,000 annually on fuel can expect to save $50,000-60,000 in direct costs, with additional savings from reduced vehicle maintenance and administrative time.
Q: What compliance requirements must government route optimization systems meet?
Government route optimization software must comply with Section 508 accessibility standards, maintain appropriate data security certifications, and follow procurement regulations. The system should provide audit trails for GPS tracking data and employee information while meeting relevant privacy regulations for citizen service records.
Q: How do you measure ROI for government route optimization projects?
Calculate baseline costs for fuel, overtime, and vehicle maintenance, then apply conservative improvement percentages. Include supervisor time savings at hourly rates and document service delivery improvements like faster response times and increased daily capacity. Zeo Route Planner’s GPS tracking and analytics features help government agencies document these metrics with the transparency budget committees require.
Q: What’s the typical implementation timeline for government route optimization?
Most government agencies see initial results within 30-60 days and full ROI within 8-12 months. The timeline includes procurement (2-4 weeks), pilot program (4-6 weeks), training (2-3 weeks), and gradual rollout (4-8 weeks). Change management and union coordination can extend timelines but improve long-term adoption.
Q: How does route optimization improve emergency response times for public services?
Route optimization strategically positions crews across service areas and uses real-time tracking to identify the closest available team for emergency calls. This approach can reduce emergency response times by 10-15 minutes on average, as demonstrated in public works departments managing water main breaks, road hazards, and infrastructure emergencies.
Government route optimization delivers measurable taxpayer value while improving public service delivery. These case studies demonstrate that strategic implementation generates substantial ROI through reduced costs and enhanced operations.
Ready to explore how route optimization can transform your government operations? Request a government-specific demo and ROI analysis tailored to your municipality’s unique needs.
Are you a fleet owner?
Want to manage your drivers and deliveries easily?
Grow your business effortlessly with Zeo Routes Planner – optimize routes and manage multiple drivers with ease.
increase fuel savings
Hassle Free Deliveries & Pickups!
Optimize routes with our algorithm, reducing travel time and costs efficiently.
Get Started for Free