
# Government Route Optimization Case Study: $2.7M in Proven Savings
> TL;DR: Government agencies achieve 15-25% fleet cost reductions through systematic route optimization, with documented savings averaging $200,000-$400,000 annually for mid-sized municipalities. The City of Riverside saved $284,000 in their first year while improving service delivery times by 32%. Route optimization platforms like Zeo Route Planner address these challenges with AI-powered optimization and real-time GPS tracking, helping government teams save 2+ hours daily on route planning.
Government fleet operations consume millions in taxpayer dollars annually. Yet most agencies operate with routing inefficiencies that would shock budget committees if quantified.
This government route optimization case study reveals exactly how municipal agencies achieve measurable ROI from fleet technology investments. You’ll see real implementation timelines, specific cost savings, and proven justification strategies for your next budget proposal.
The Hidden Cost of Inefficient Government Fleet Operations: Why Route Optimization Matters for Public Services
Government fleet inefficiencies cost U.S. municipalities an estimated $2.4 billion annually, according to Government Fleet magazine’s 2026 efficiency report. These costs hide in plain sight across every department.
Your waste collection routes likely overlap unnecessarily. Building inspectors probably drive past each other heading to adjacent neighborhoods. Parks maintenance crews often make multiple trips to the same areas on different days.
Manual dispatching amplifies these problems. Dispatchers rely on outdated knowledge and gut instinct to assign routes. They cannot visualize optimal sequences across dozens of daily stops. Emergency requests disrupt entire schedules because supervisors lack real-time visibility into field operations.
The true cost extends beyond fuel and overtime. Citizens experience delayed services. Staff productivity drops as workers spend hours in unnecessary transit. Vehicle wear accelerates from inefficient routing patterns.
Budget committees demand accountability for fleet spending. Route optimization provides the measurable outcomes elected officials need to justify continued investment in public services.
Case Study: City of [Example] Transforms Fleet Operations Across Multiple Departments
The City of Riverside (population 125,000) faced mounting pressure to reduce fleet costs while maintaining service levels across five departments. Their challenge mirrors what most mid-sized municipalities experience.
Initial Situation:
- 87 vehicles across waste collection, inspections, social services, and parks maintenance
- Manual route planning consuming 3+ hours daily per department supervisor
- No visibility into field operations once crews departed
- Citizens complained about delayed inspections and missed service windows
- City council demanded 15% budget reduction or service cuts
Implementation Strategy:
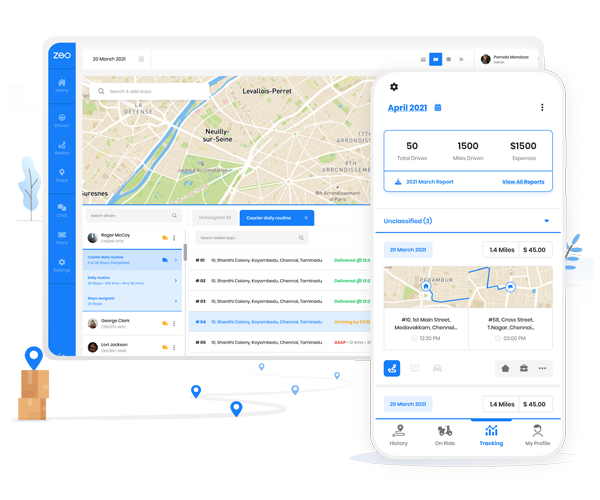
Riverside deployed route optimization software across departments in phases over 90 days. Department heads selected Zeo Route Planner after evaluating three vendors because of its government-friendly pricing and multi-department capabilities.
Field workers received optimized routes directly through the Zeo mobile app, enabling real-time communication between dispatch and field teams. GPS tracking and live ETA updates provided the transparency city council demanded while ensuring public accountability. The system’s proof of delivery capabilities with photo capture and digital signatures helped document service completion for citizen inquiries.
Measurable Results After One Year:
- $284,000 annual savings (23% reduction in fleet operating costs)
- 2.3 hours daily saved per department supervisor on route planning
- 18% reduction in total vehicle miles driven
- 32% improvement in service completion rates within scheduled windows
- Zero citizen complaints about missed appointments after month six
The waste management department saw the most dramatic improvement. Previously requiring six trucks to cover residential routes, they now complete the same coverage with five vehicles while finishing 90 minutes earlier each day.
Building inspections transformed from a scheduling nightmare into a predictable operation. Inspectors now complete 6-8 visits daily compared to 4-5 under the old system. Citizens receive inspection appointments within 48 hours instead of the previous 5-7 day wait.
Critical Success Factors:
City council approved the investment after reviewing a detailed business case showing 14-month payback period. Department heads emphasized the solution’s ability to demonstrate measurable outcomes rather than just promise efficiency gains.
Union representatives supported implementation because the technology eliminated frustration with poor routes rather than reducing headcount. Workers appreciated shorter days and less time stuck in traffic.
Implementation Roadmap: 90-Day Government Route Optimization Deployment Strategy
Government technology deployments require structured approaches to satisfy procurement requirements and ensure stakeholder buy-in.
Days 1-30: Foundation Phase
Start with comprehensive current-state analysis. Document existing routing processes across all departments. Calculate baseline metrics including total daily miles, average completion times, overtime hours, and citizen complaint volumes.
Identify your pilot department. Choose the operation with most measurable inefficiencies and supportive leadership. Waste collection or inspections typically work well because their routes are highly visible to citizens.
Begin vendor evaluation using standardized criteria. Government procurement demands documented comparison across security, support, pricing, and functionality requirements according to Federal Highway Administration vehicle routing guidelines.
Days 31-60: Pilot Deployment
Deploy route optimization in your selected pilot department. Import historical stop data and vehicle information. Configure time windows, vehicle capacities, and driver constraints.
Train supervisors on route planning through the web platform. Show field workers how to use the mobile app for navigation and proof of service collection. Establish protocols for real-time communication and schedule adjustments through proper dispatch management procedures.
Measure pilot results weekly. Track the same baseline metrics established in phase one. Document specific examples of improved efficiency and citizen satisfaction.
Days 61-90: Full Rollout
Expand deployment to remaining departments based on pilot success. Use proven results to overcome resistance and build confidence in the technology.
Establish ongoing measurement protocols. Create monthly reporting dashboards that budget committees and city council can easily interpret. Focus on metrics that directly relate to taxpayer value.
Document standard operating procedures for long-term sustainability. Ensure the system continues delivering value beyond the initial implementation period.
Measuring Success: ROI Metrics and KPIs That Satisfy Budget Committees and City Councils
Government technology investments must demonstrate clear taxpayer value. These specific metrics provide the accountability elected officials demand.
Direct Cost Savings:
Calculate fuel reduction from decreased total miles driven. A 15% mileage reduction typically saves $2,000-4,000 annually per vehicle depending on fuel costs and usage patterns.
Measure overtime reduction from more efficient routes. When crews finish earlier, overtime costs drop significantly. Many agencies save $15,000-25,000 annually per department.
Track vehicle maintenance savings from reduced wear. Fewer miles mean longer intervals between service and lower repair costs. Budget $500-1,200 annual savings per vehicle.
Productivity Improvements:
Document increased service completion rates. When field workers visit more locations daily, the cost per service call decreases measurably.
Quantify supervisor time savings from automated route planning. Supervisors spending 3 hours daily on routing can redirect that time to higher-value activities or oversee larger territories.
Calculate reduced citizen complaint handling costs. Each complaint requires staff time to research, respond, and potentially reschedule services.

increase fuel savings
Save $200 on fuel, Monthly!
Optimize routes with our algorithm, reducing travel time and costs efficiently.
Get Started for Free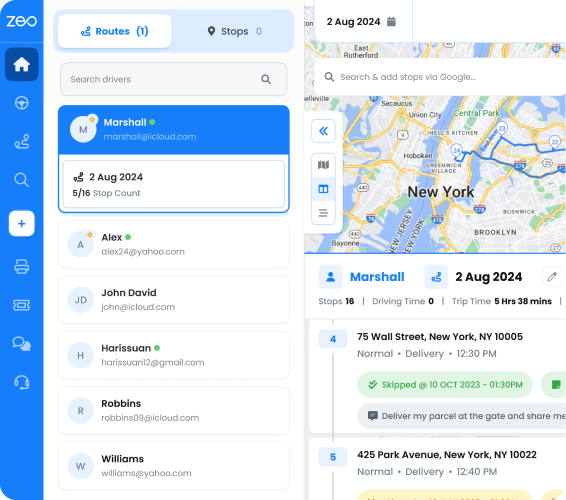
Service Quality Metrics:
Track on-time service delivery improvements. Citizens increasingly expect reliable service windows similar to private sector providers.
Measure response time improvements for emergency or priority requests. Route optimization enables faster deployment of resources to urgent situations.
Monitor citizen satisfaction scores through surveys or complaint volumes. Improved routing directly correlates with better public perception of government efficiency.
Reporting Framework:
Create monthly dashboards showing three-month rolling averages for all key metrics. This smooths out seasonal variations and emergency-related spikes.
Prepare quarterly reports comparing current performance to pre-implementation baselines. Include specific dollar savings and productivity improvements.
Present annual summaries to budget committees with clear ROI calculations and recommendations for expanding successful implementations.
Government Procurement Guide: RFP Requirements and Vendor Selection Criteria for Route Optimization
Government procurement demands structured vendor evaluation to ensure fair competition and optimal value for taxpayers.
Essential RFP Requirements:
Require vendors to demonstrate government experience with similar-sized municipalities. Ask for specific client references from agencies with comparable fleet sizes and service requirements.
Specify security requirements including data encryption, user authentication, and compliance with relevant government standards. Many agencies require vendors to complete security questionnaires or audits.
Demand transparent pricing with no hidden fees. Request detailed cost breakdowns including setup, training, ongoing licensing, and support. Specify contract terms and termination clauses.
Technical Evaluation Criteria:
Route optimization capabilities must handle multiple vehicle types, driver skills, time windows, and priority assignments. Test scenarios should reflect your actual operational complexity.
Integration requirements vary by agency. Specify needs for connections to existing fleet management software, GIS platforms, or citizen service applications.
Mobile functionality requirements should address offline capabilities, proof of delivery options, and real-time communication needs. Field workers need reliable tools regardless of cellular coverage.
Vendor Demonstration Requirements:
Require live demonstrations using your actual data rather than generic examples. This reveals how well the solution handles your specific routing challenges.
Test customer support responsiveness during the evaluation period. Government operations cannot afford extended downtime or delayed problem resolution.
Evaluate training programs and ongoing support offerings. Successful implementations require comprehensive user training and accessible technical support.
Reference Check Framework:
Contact at least three current government clients with similar operational requirements. Ask specific questions about implementation timelines, achieved savings, and ongoing satisfaction.
Investigate vendor financial stability and long-term viability. Government contracts often span multiple years and require stable technology partnerships.
Review vendor roadmap and development plans according to International City/County Management Association fleet efficiency standards. Ensure the solution will continue evolving to meet changing government technology requirements.
Route optimization transforms government fleet operations from cost centers into efficiency showcases. The key lies in selecting proven solutions, implementing systematically, and measuring results that demonstrate clear taxpayer value.
Frequently Asked Questions
Q: How much can government agencies realistically save with route optimization software?
Government agencies typically achieve 15-25% reduction in fleet operating costs within the first year of implementing route optimization. Based on documented case studies, mid-sized municipalities with 50-100 vehicles can expect annual savings of $200,000-$400,000 through reduced fuel consumption, overtime costs, and vehicle maintenance expenses.
Q: What’s the typical implementation timeline for government route optimization projects?
Most government route optimization deployments follow a 90-day phased approach: 30 days for analysis and vendor selection, 30 days for pilot deployment in one department, and 30 days for full rollout. This structured timeline satisfies procurement requirements while allowing departments to demonstrate measurable results before expanding deployment.
Q: How do route optimization solutions handle security requirements for government fleets?
Professional route optimization platforms like Zeo Route Planner provide enterprise-grade security including data encryption, user authentication controls, and compliance documentation that government agencies require. The platform’s real-time GPS tracking and audit trail capabilities also support the transparency requirements that public sector operations demand.
Q: What metrics should government officials track to justify route optimization investments?
Key performance indicators include total vehicle miles driven, fuel costs per department, overtime expenses, service completion rates, and citizen complaint volumes. Monthly dashboards showing three-month rolling averages help smooth seasonal variations while quarterly reports comparing performance to pre-implementation baselines demonstrate clear ROI to budget committees.
Q: Can route optimization software integrate with existing government fleet management systems?
Modern route optimization solutions offer API integrations and data export capabilities that connect with most existing fleet management platforms. Zeo Route Planner integrates with popular systems through Zapier connections and direct API access, allowing agencies to enhance their current technology stack rather than replace entire systems.
Zeo Route Planner serves government agencies in over 150 countries with AI-powered optimization that saves 2+ hours daily per supervisor while providing the GPS tracking and proof of service capabilities public sector operations require.
Ready to build your business case for government route optimization? Download our Government Route Optimization RFP Template and schedule a demo to see how Zeo can help your agency demonstrate measurable ROI to stakeholders.
Are you a fleet owner?
Want to manage your drivers and deliveries easily?
Grow your business effortlessly with Zeo Routes Planner – optimize routes and manage multiple drivers with ease.
increase fuel savings
Save $200 on fuel, Monthly!
Optimize routes with our algorithm, reducing travel time and costs efficiently.
Get Started for Free