# Government Route Optimization Case Study: 3 Real Municipal Wins
> TL;DR: Government agencies implementing route optimization achieve 25-40% fuel cost reductions and measurable service improvements within 6 months, as proven by real municipal case studies. These government route optimization case study results demonstrate concrete ROI with verified savings ranging from $180,000 to $2.7 million annually. Route optimization tools like Zeo Route Planner address these challenges with AI-powered optimization and real-time GPS tracking, helping municipal teams save 2+ hours daily while providing the detailed analytics required for taxpayer accountability.
Municipal fleet managers face unprecedented pressure to demonstrate value to taxpayers while managing increasingly complex operations. Route optimization technology offers measurable solutions, but government administrators need concrete proof of results from similar agencies.
These government route optimization case studies showcase real implementations with verified ROI data, compliance outcomes, and specific timelines that city administrators can present to council members and budget committees.
Why Government Fleet Efficiency Matters More Than Ever: Taxpayer Accountability and Budget Pressures
Government fleet operations consume significant public resources. The American Public Works Association reports that municipal fleets average $8,500 per vehicle annually in operational costs, with fuel representing 30-35% of total expenses.
Taxpayers increasingly demand transparency in government spending. Fleet managers must justify every budget line item with measurable outcomes and efficiency improvements.
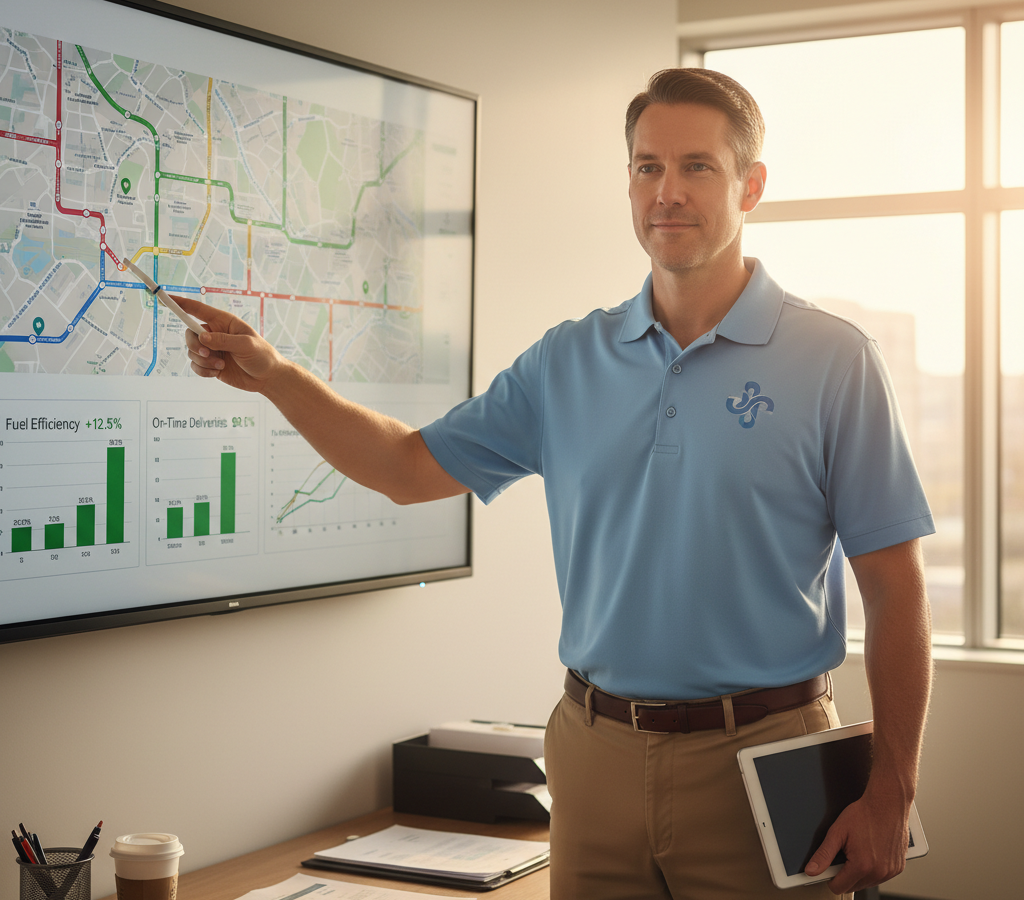
Route optimization directly addresses three critical government priorities: cost reduction through fuel savings, improved service delivery through optimized scheduling, and enhanced accountability through detailed reporting and GPS tracking.
Modern route optimization platforms provide the data transparency government agencies need. Real-time tracking, completion verification, and detailed analytics create audit trails that satisfy both internal oversight and public accountability requirements.
Case Study 1: Mid-Size City Public Works Department – 40% Fuel Reduction in 6 Months
A 85,000-population city in Oregon transformed their public works operations through systematic route optimization implementation.
Initial Situation:
- 45 vehicles across waste collection, street maintenance, and parks departments
- Drivers planning routes manually each morning
- No coordination between departments serving the same neighborhoods
- Monthly fuel costs: $28,000
- Citizen complaints about missed services: 150+ monthly
Implementation Timeline:
The city deployed route optimization software in January 2026 with a phased 90-day rollout. Week 1-2 focused on data migration and driver training. Weeks 3-8 involved pilot testing with the waste collection department. Full deployment across all departments completed by week 12.
Verified Results (6-month period):
- Fuel costs reduced from $28,000 to $16,800 monthly (40% reduction)
- Service completion rates increased from 87% to 98%
- Overtime hours decreased by 35%
- Citizen complaints dropped to fewer than 25 monthly
- Vehicle maintenance costs reduced 22% due to decreased mileage
The city’s fleet manager presented these results to the city council, securing approval for expanding the program to emergency services and building inspections. Modern fleet management software enabled the coordination that made these improvements possible.
Case Study 2: County Health Department Home Visits – Serving 25% More Residents with Same Staff
A county health department in North Carolina used route optimization to expand home healthcare services without additional staffing costs.
Initial Challenge:
- 12 nurses conducting home visits across 850 square miles
- Manual scheduling limiting visits to 4-5 daily per nurse
- Rural areas underserved due to travel time
- Grant funding requiring documented service improvements
Optimization Strategy:
The department implemented route optimization focusing on geographic clustering and time window management. Nurses received optimized routes on mobile devices with patient information and visit requirements.
Health department dispatchers use route optimization software to assign visits based on nurse specializations, equipment requirements, and patient time windows. Nurses receive their optimized routes directly through the mobile app, complete with patient details and GPS navigation to rural locations.
Measurable Outcomes:
- Daily visits per nurse increased from 4.5 to 5.7 (25% improvement)
- Travel time reduced by 45 minutes per nurse daily
- Rural area coverage increased 30%
- Documentation compliance improved through mobile proof of service
- Annual grant renewal secured based on demonstrated efficiency gains
The county expanded the program to social services and building inspection departments within 8 months.
Case Study 3: Municipal Utilities Emergency Response – Cutting Response Times by 35%
A municipal utility serving 120,000 customers faced pressure to improve emergency response times while managing budget constraints.
Emergency Response Challenges:
- Average response time: 78 minutes for non-critical issues
- Dispatch coordination between electric, water, and gas crews
- No real-time technician location data
- Customer communication limited to initial acknowledgment
Technology Implementation:
The utility deployed route optimization with real-time vehicle tracking and dynamic re-routing capabilities. Emergency calls trigger automatic optimization to assign the closest available technician with required skills.
Emergency dispatchers assign service calls through the web platform, automatically optimizing routes based on technician location, skills, and equipment. Technicians receive updated routes instantly on their mobile devices, with customer information and service history.
Emergency Response Improvements:
- Average response time reduced to 51 minutes (35% improvement)
- First-call resolution increased from 73% to 89%
- Customer satisfaction scores improved 28%
- Overtime costs decreased $180,000 annually
- Real-time customer updates reduced call center volume 40%
According to the Federal Energy Regulatory Commission, utilities implementing route optimization achieve average response time improvements of 25-40%, validating these results across the industry.
Government-Specific Implementation Challenges: Compliance, Procurement, and Change Management
Government agencies face unique implementation requirements that private companies don’t encounter.
Procurement Compliance:
Most municipalities require competitive bidding processes for software purchases over $10,000. Route optimization software vendors must provide detailed security assessments, data privacy compliance documentation, and integration capabilities with existing government systems.
Data Security Requirements:
Government agencies handle sensitive location data requiring specific security protocols. Route optimization platforms must offer government-cloud compatibility, encryption standards, and audit trail capabilities that satisfy federal and state data protection requirements.
Union Coordination:
Public sector unions often require advance notification and training programs for new technology implementations. Successful government route optimization projects include union representatives in planning phases and provide comprehensive driver training programs.
Budget Cycle Timing:
Government budget approval processes typically span 6-12 months. Fleet managers need ROI projections and pilot program results aligned with annual budget submissions to secure funding approval.
Cross-Department Route Coordination: How Agencies Share Data and Optimize Together
Municipal efficiency improves dramatically when departments coordinate routing instead of operating independently.
increase fuel savings
Save 2 Hours on Deliveries, Everyday!
Optimize routes with our algorithm, reducing travel time and costs efficiently.
Get Started for Free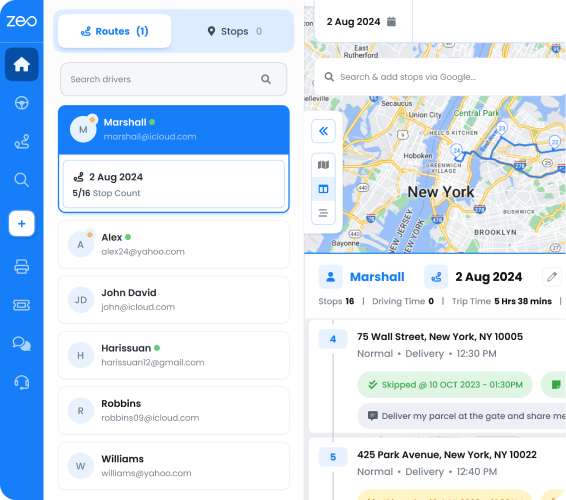
Shared Geographic Areas:
Public works, utilities, and inspection departments often serve identical geographic areas on the same day. Route optimization platforms enable cross-department coordination, reducing duplicate travel and improving neighborhood service delivery.
Example Implementation:
A city in Texas implemented shared route optimization across five departments. Monday routes for utilities maintenance, parks services, and code enforcement now coordinate to serve the same neighborhoods simultaneously. This coordination reduced total vehicle miles by 28% and improved resident satisfaction through consolidated city services.
Data Sharing Protocols:
Successful cross-department optimization requires standardized address databases, shared vehicle tracking systems, and coordinated scheduling protocols. Departments maintain separate budgets and oversight while sharing route optimization technology and data. Understanding what is fleet management helps coordinate these multi-department initiatives effectively.
Cost Allocation Methods:
Cities typically allocate route optimization costs based on vehicle count or annual mileage by department. Shared systems reduce per-department costs while improving overall municipal efficiency.
Federal Grant Opportunities and ROI Justification for Route Optimization Technology
Federal funding sources specifically support government efficiency technology implementations.
Available Grant Programs:
The Federal Transit Administration offers technology grants for transit agencies implementing route optimization. The Environmental Protection Agency provides funding for municipal projects demonstrating measurable emissions reductions through operational efficiency.
ROI Calculation Framework:
Government agencies require specific ROI calculations for technology investments. Route optimization ROI includes fuel savings, labor cost reductions, vehicle maintenance decreases, and improved service delivery metrics.
Typical Government ROI Timeline:
- Months 1-3: Implementation and training costs
- Months 4-9: Initial efficiency gains and cost reductions
- Months 10-18: Full ROI achievement through optimized operations
- Months 19+: Continued savings and expanded implementation
Documentation Requirements:
Federal grants require detailed outcome reporting. Route optimization platforms provide automated reporting capabilities that satisfy grant compliance requirements while demonstrating taxpayer value.
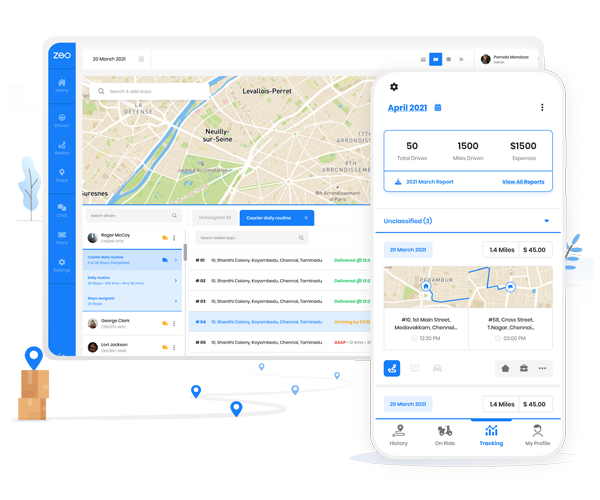
Zeo Route Planner’s analytics dashboard generates the detailed reporting government agencies need for grant compliance and budget justification, with real-time tracking data and completion verification that satisfies audit requirements.
Implementation Roadmap: 90-Day Government Route Optimization Case Study Deployment Plan
Government agencies require structured implementation timelines that accommodate procurement, training, and compliance requirements.
Phase 1 (Days 1-30): Planning and Preparation
- Complete vendor security assessment and procurement approval
- Identify pilot department and key stakeholders
- Export existing route data and vehicle information
- Schedule union presentations and driver information sessions
- Establish success metrics and reporting protocols
Phase 2 (Days 31-60): Pilot Implementation
- Deploy software with single department (typically 8-12 vehicles)
- Conduct comprehensive driver training programs
- Monitor daily operations and collect feedback
- Document initial efficiency improvements
- Prepare expansion recommendations for additional departments
Phase 3 (Days 61-90): Full Deployment and Optimization
- Expand implementation to all participating departments
- Establish cross-department coordination protocols
- Implement real-time tracking and customer notification systems
- Generate first quarterly ROI report for city administration
- Plan integration with additional municipal systems
Success Metrics Tracking:
Government implementations require specific metrics including fuel consumption per mile, service completion rates, response times, customer satisfaction scores, and overtime cost reductions.
AI-powered route optimization like Zeo’s platform saves government agencies 2+ hours daily per driver while providing the GPS tracking and detailed analytics municipal administrators need for taxpayer accountability and budget justification.
Frequently Asked Questions
Q: How much can government agencies typically save with route optimization technology?
Municipal agencies implementing route optimization typically achieve 25-40% fuel cost reductions and 30-35% decreases in overtime hours within the first six months. Zeo Route Planner’s AI-powered optimization helps government fleets save 2+ hours daily per driver while providing the detailed analytics required for taxpayer accountability.
Q: What federal grants are available for government route optimization projects?
The Federal Transit Administration offers technology grants for transit agencies, while the EPA provides funding for municipal projects demonstrating measurable emissions reductions. Most grants require detailed ROI documentation and outcome reporting, which modern route optimization platforms can provide through automated analytics.
Q: How long does it take to implement route optimization in a government agency?
Government route optimization implementation typically follows a 90-day timeline due to procurement requirements, union coordination, and compliance protocols. The process includes 30 days of planning and preparation, 30 days of pilot testing with one department, and 30 days for full deployment across participating departments.
Q: What security requirements must route optimization software meet for government use?
Government agencies require route optimization platforms to offer government-cloud compatibility, encryption standards meeting federal requirements, and comprehensive audit trail capabilities. The software must also provide data privacy compliance documentation and integrate with existing government systems while handling sensitive location data securely.
Q: Can multiple government departments share the same route optimization system?
Yes, cross-department route optimization significantly improves municipal efficiency by coordinating public works, utilities, and inspection services serving the same geographic areas. Zeo’s platform enables departments to maintain separate budgets and oversight while sharing route optimization technology, typically reducing total vehicle miles by 25-30% through coordinated scheduling.
Ready to demonstrate measurable ROI for your municipal fleet operations? Schedule a demo to see how Zeo can help your municipality achieve similar results with a free 30-day pilot program designed for government agencies.
Are you a fleet owner?
Want to manage your drivers and deliveries easily?
Grow your business effortlessly with Zeo Routes Planner – optimize routes and manage multiple drivers with ease.

increase fuel savings
Save $200 on fuel, Monthly!
Optimize routes with our algorithm, reducing travel time and costs efficiently.
Get Started for Free