

# How to Optimize Exterminator Routes: Cut Fuel Costs by 30%
Running a pest control business means juggling regular maintenance schedules with urgent emergency calls. One day you’re handling routine quarterly treatments. The next, you’re scrambling to fit in three wasp nest removals before lunch.
If you’re spending over two hours each morning planning routes for your technicians, you’re not alone. Most pest control operations lose money on inefficient routing before they even start their engines. Learning how to optimize exterminator routes is crucial for profitability in today’s competitive market.
The good news? Strategic pest control route planning can slash your fuel costs by 30% while improving customer satisfaction. Here’s exactly how to transform your chaotic scheduling into a profit-generating system.
The Hidden Costs of Inefficient Exterminator Routes (Why Manual Planning is Killing Your Profits)
Manual route planning doesn’t just waste your morning. It bleeds money throughout your entire operation.
Consider Sarah, who runs a pest control company with eight technicians in Phoenix. She starts each day at 6 AM, plotting routes on a paper map. By the time she assigns routes via text, it’s 7:30 AM. Her technicians are already running late.
Here’s what inefficient exterminator routes actually cost you:
Time Hemorrhage: The average pest control manager spends 2.5 hours daily on route planning. That’s 12.5 hours per week – nearly a full workday lost to logistics instead of growing your business.
Fuel Waste: Poor routing means technicians drive 25-40% more miles than necessary. With commercial vehicle fuel costs averaging $4+ per gallon, an inefficient route costing an extra 20 miles daily costs $240+ monthly per technician.
Overtime Expenses: When routes run long due to poor planning, technicians work overtime. This 1.5x pay rate adds up fast across multiple employees.
Customer Dissatisfaction: Late arrivals mean missed appointment windows. Unhappy customers don’t renew annual contracts. The average pest control customer is worth $800+ annually – losing even two customers monthly costs $19,200 yearly.
Technician Burnout: Driving excessive miles wears out your team. High turnover means constant hiring and training costs.
The math is brutal. A 10-technician operation loses approximately $45,000 annually to routing inefficiencies. That’s enough to hire another full-time technician.
Route Optimization Fundamentals for Pest Control: Beyond Basic Mapping
Effective pest control routing goes far beyond plotting dots on a map. You’re managing different service types, treatment schedules, and technician specializations through comprehensive field service management.
Service Time Variables: A routine quarterly spray takes 30-45 minutes. Termite inspections need 60-90 minutes. Rodent exclusion can require 2-3 hours. Your routing system must account for these time differences.
Chemical and Equipment Considerations: Not every technician can handle every job. Some treatments require specialized licenses or equipment. Your routes must match the right technician to the right service type.
Property Access Requirements: Commercial accounts often have specific arrival windows. Residential customers may only be available evenings or weekends. Route optimization must balance these constraints with geographical efficiency.
Treatment Intervals: Monthly, quarterly, and annual services create complex scheduling patterns. Efficient routing ensures you’re not sending technicians to the same neighborhood multiple times when you could consolidate trips.
Vehicle Capacity: Trucks have weight limits and storage constraints. Routes must consider chemical loads and equipment needs for each stop.
The key is creating clusters of similar services with compatible timing. Instead of sending one technician across town for a single quarterly treatment, group nearby quarterly services together.
Seasonal Route Strategy: Adapting to Peak Pest Season vs. Off-Season Scheduling
Pest control demand fluctuates dramatically throughout the year. Your routing strategy must adapt to these seasonal patterns.
Spring Rush (March-May): This is your make-or-break season. Demand spikes 40-60% as customers emerge from winter. You need maximum efficiency to capture revenue without overwhelming your team.
During peak season, prioritize geographical clustering. Create dedicated zones for each technician to minimize drive time between appointments. A well-planned spring route can serve 8-10 customers daily instead of the typical 5-6.
Summer Maintenance (June-August): Steady demand with predictable service intervals. Focus on consistency and customer retention. This is when you optimize recurring routes for maximum efficiency.
Build “milk runs” – standardized routes that repeat weekly or monthly. Technicians become familiar with properties, reducing service time by 10-15% through experience.
Fall Prep (September-November): Customers want winter protection treatments. Demand is high but weather windows can be unpredictable. Build flexibility into your routes.
Winter Strategy (December-February): Reduced demand but emergency calls increase. Indoor pest problems spike. Your routing must be agile enough to handle urgent calls while maintaining regular commercial accounts.
During off-season, consolidate routes to keep technicians busy. Instead of running five partial routes, create three full routes that keep your best performers active while reducing overhead.
Handling Emergency Calls: Dynamic Route Adjustment Without Destroying Your Schedule
Emergency pest calls are profit opportunities disguised as scheduling nightmares. The key is having systems that can adapt without chaos through automated route planning.
Here’s the reality: You’ll get 3-7 emergency calls daily during peak season. Wasps, rodent sightings, and ant infestations can’t wait. But disrupting optimized routes costs money and frustrates customers.
The Buffer System: Build 60-90 minute buffers into each technician’s schedule. This creates capacity for emergency insertions without overtime. Yes, it feels like leaving money on the table. But the flexibility pays for itself in customer satisfaction and reduced stress.
Geographic Emergency Zones: When an emergency call comes in, assign it to the technician already closest to that area. Don’t pull someone from across town unless absolutely necessary.
Emergency Pricing Strategy: Charge premium rates for same-day emergency service. This higher margin offsets the routing disruption and helps customers understand the true cost of urgent service.
Smart Rescheduling: When emergencies disrupt regular appointments, reschedule within 48 hours. Don’t push customers to next week. Quick rescheduling shows professionalism and maintains relationship strength.
Communication Protocol: Notify affected customers immediately about delays. A simple text saying “Running 30 minutes behind due to emergency call, still able to serve you today” prevents frustration.
Modern route planning tools can dynamically adjust schedules when emergencies arise. Your office manager can reassign stops in real-time while technicians receive updated routes directly on their phones through mobile apps, complete with turn-by-turn navigation and customer details.
Complete Implementation Guide: 30-60-90 Day Route Optimization Rollout
Transforming your routing system requires methodical implementation. Here’s your step-by-step roadmap:
Days 1-30: Foundation Phase
Week 1: Data Collection
- Document current routes and service times
- Track miles driven per technician daily
- Record fuel costs and overtime hours
- List customer time windows and access requirements
Week 2: Customer Segmentation
- Group customers by service type (residential, commercial, specialty)
- Identify geographical clusters
- Note seasonal patterns and treatment frequencies
Week 3: Technician Assessment
- Document each technician’s skills and certifications
- Identify equipment and vehicle constraints
- Establish productivity benchmarks
Week 4: Tool Selection and Setup
- Choose route optimization software
- Import customer data and addresses
- Set up vehicle profiles and service time estimates
Days 31-60: Implementation Phase
increase fuel savings
Save 2 Hours on Deliveries, Everyday!
Optimize routes with our algorithm, reducing travel time and costs efficiently.
Get Started for Free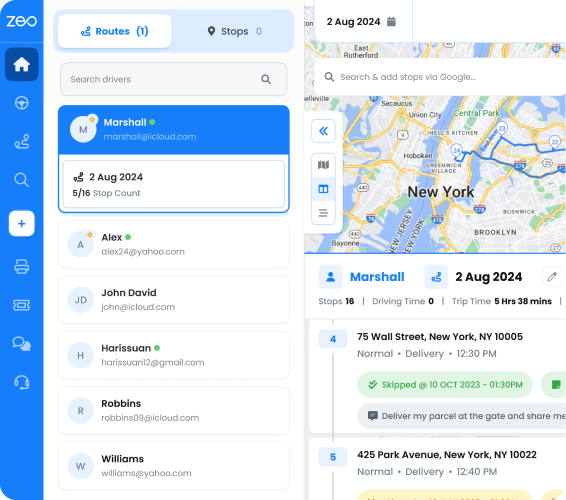
Week 5-6: Pilot Testing
- Start with your most experienced technician
- Run parallel systems (old and new) to compare results
- Track time savings and customer feedback
Week 7-8: Gradual Rollout
- Add 2-3 more technicians to the optimized system
- Train staff on new procedures
- Refine time estimates based on real performance
Days 61-90: Optimization Phase
Week 9-10: Full Implementation
- Move all technicians to optimized routing
- Implement dynamic rescheduling for emergencies
- Establish new performance metrics
Week 11-12: Fine-Tuning
- Adjust service time estimates using AI route optimization
- Optimize customer clusters
- Train office staff on advanced features
The key is gradual implementation. Don’t shock your system by changing everything overnight. Each phase builds on the previous one, ensuring smooth adoption.
During implementation, your managers can plan and assign routes through a web platform while technicians receive their optimized schedules through mobile apps. When emergency calls come in, routes update in real-time without requiring phone calls or radio communication.
Measuring Success: ROI Calculator and KPIs Every Pest Control Business Should Track
Route optimization success isn’t just about feeling more organized. It’s about measurable financial impact.
Core KPIs to Track Weekly:
Miles Per Technician: Baseline this before optimization. Target 15-30% reduction within 90 days.
Services Per Day: Track appointments completed per technician. Efficient routing should increase this by 1-2 services daily.
Fuel Costs Per Route: Monitor weekly fuel expenses. Optimized routes typically save $200-400 monthly per technician.
Customer Wait Times: Measure appointment punctuality. Target 90%+ on-time arrival rate.
Overtime Hours: Track weekly overtime per employee. Route optimization should reduce this by 20-40%.
ROI Calculation Example:
Consider a 5-technician pest control operation:
Current Costs (Monthly):
- Route planning time: 50 hours × $25/hour = $1,250
- Excess fuel: 5 technicians × $300 = $1,500
- Overtime pay: 40 hours × $37.50 = $1,500
- Total monthly waste: $4,250
Post-Optimization (Monthly):
- Route planning time: 10 hours × $25/hour = $250
- Fuel costs: 5 technicians × $200 = $1,000
- Overtime pay: 10 hours × $37.50 = $375
- Total monthly costs: $1,625
Monthly savings: $2,625
Annual savings: $31,500
That’s a 285% return on investment even after accounting for software costs.
Advanced Metrics for Growth:
Customer Lifetime Value: Track whether optimized service delivery improves retention rates.
Revenue Per Mile: Calculate total revenue divided by miles driven. This shows true efficiency.
Emergency Response Time: Measure how quickly you can respond to urgent calls without disrupting regular routes.
Technician Satisfaction: Survey your team quarterly. Better routes reduce stress and improve job satisfaction.
Set up monthly reviews to assess these metrics. Route optimization is an ongoing process, not a one-time fix. Market conditions change, customers move, and your business grows. Your routing system must evolve accordingly.
The most successful pest control companies treat route optimization as a competitive advantage. While competitors waste time and fuel on inefficient routes, you’re serving more customers profitably.
Frequently Asked Questions
Q: What is the best software for exterminator route optimization?
The best exterminator route optimization software should handle pest control-specific needs like varying service times, technician specializations, and emergency call integration. Zeo Route Planner offers specialized features for pest control businesses, including dynamic rescheduling for urgent calls and mobile apps for technicians to receive optimized routes with customer details.
Q: How much can route optimization save pest control companies?
Route optimization typically saves pest control companies 15-30% on fuel costs and 2+ hours daily on planning time. A 10-technician operation can save approximately $45,000 annually through reduced fuel waste, overtime costs, and improved efficiency.
Q: How do you handle emergency pest control calls without disrupting scheduled routes?
Build 60-90 minute buffers into technician schedules and assign emergency calls to the closest available technician geographically. Use route optimization tools like Zeo Route Planner that can dynamically adjust schedules in real-time, automatically updating technician mobile apps with revised routes when emergencies arise.
Q: What metrics should pest control companies track for route optimization success?
Key metrics include miles per technician (target 15-30% reduction), services completed per day, fuel costs per route, on-time arrival rates (target 90%+), and overtime hours. Track these weekly to measure ROI and identify areas for improvement.
Q: How long does it take to implement route optimization for pest control?
Full implementation typically takes 60-90 days using a phased approach: 30 days for data collection and setup, 30 days for pilot testing and gradual rollout, and 30 days for optimization and fine-tuning. Start with your most experienced technician before expanding to the full team.
Ready to transform your pest control routing from reactive chaos to proactive efficiency? Start your free 7-day trial of Zeo Route Planner to see exactly how much time and fuel you can save with pest control-optimized routing.
Are you a fleet owner?
Want to manage your drivers and deliveries easily?
Grow your business effortlessly with Zeo Routes Planner – optimize routes and manage multiple drivers with ease.

increase fuel savings
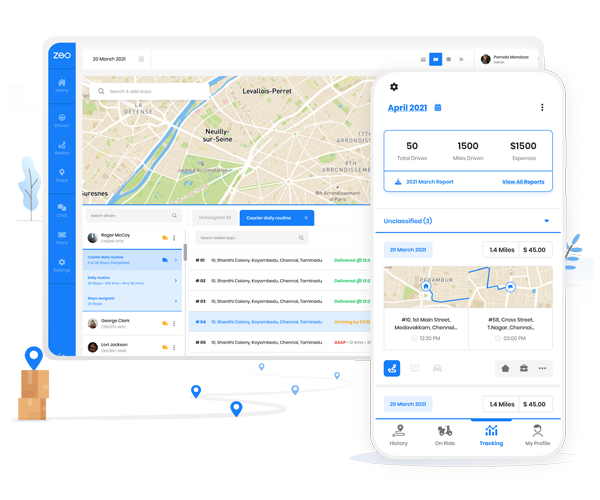
Save $200 on fuel, Monthly!
Optimize routes with our algorithm, reducing travel time and costs efficiently.
Get Started for Free